You can have 100% off, Use our $5.99 off coupon code during checkout or in cart– AIG100.
4.5/5
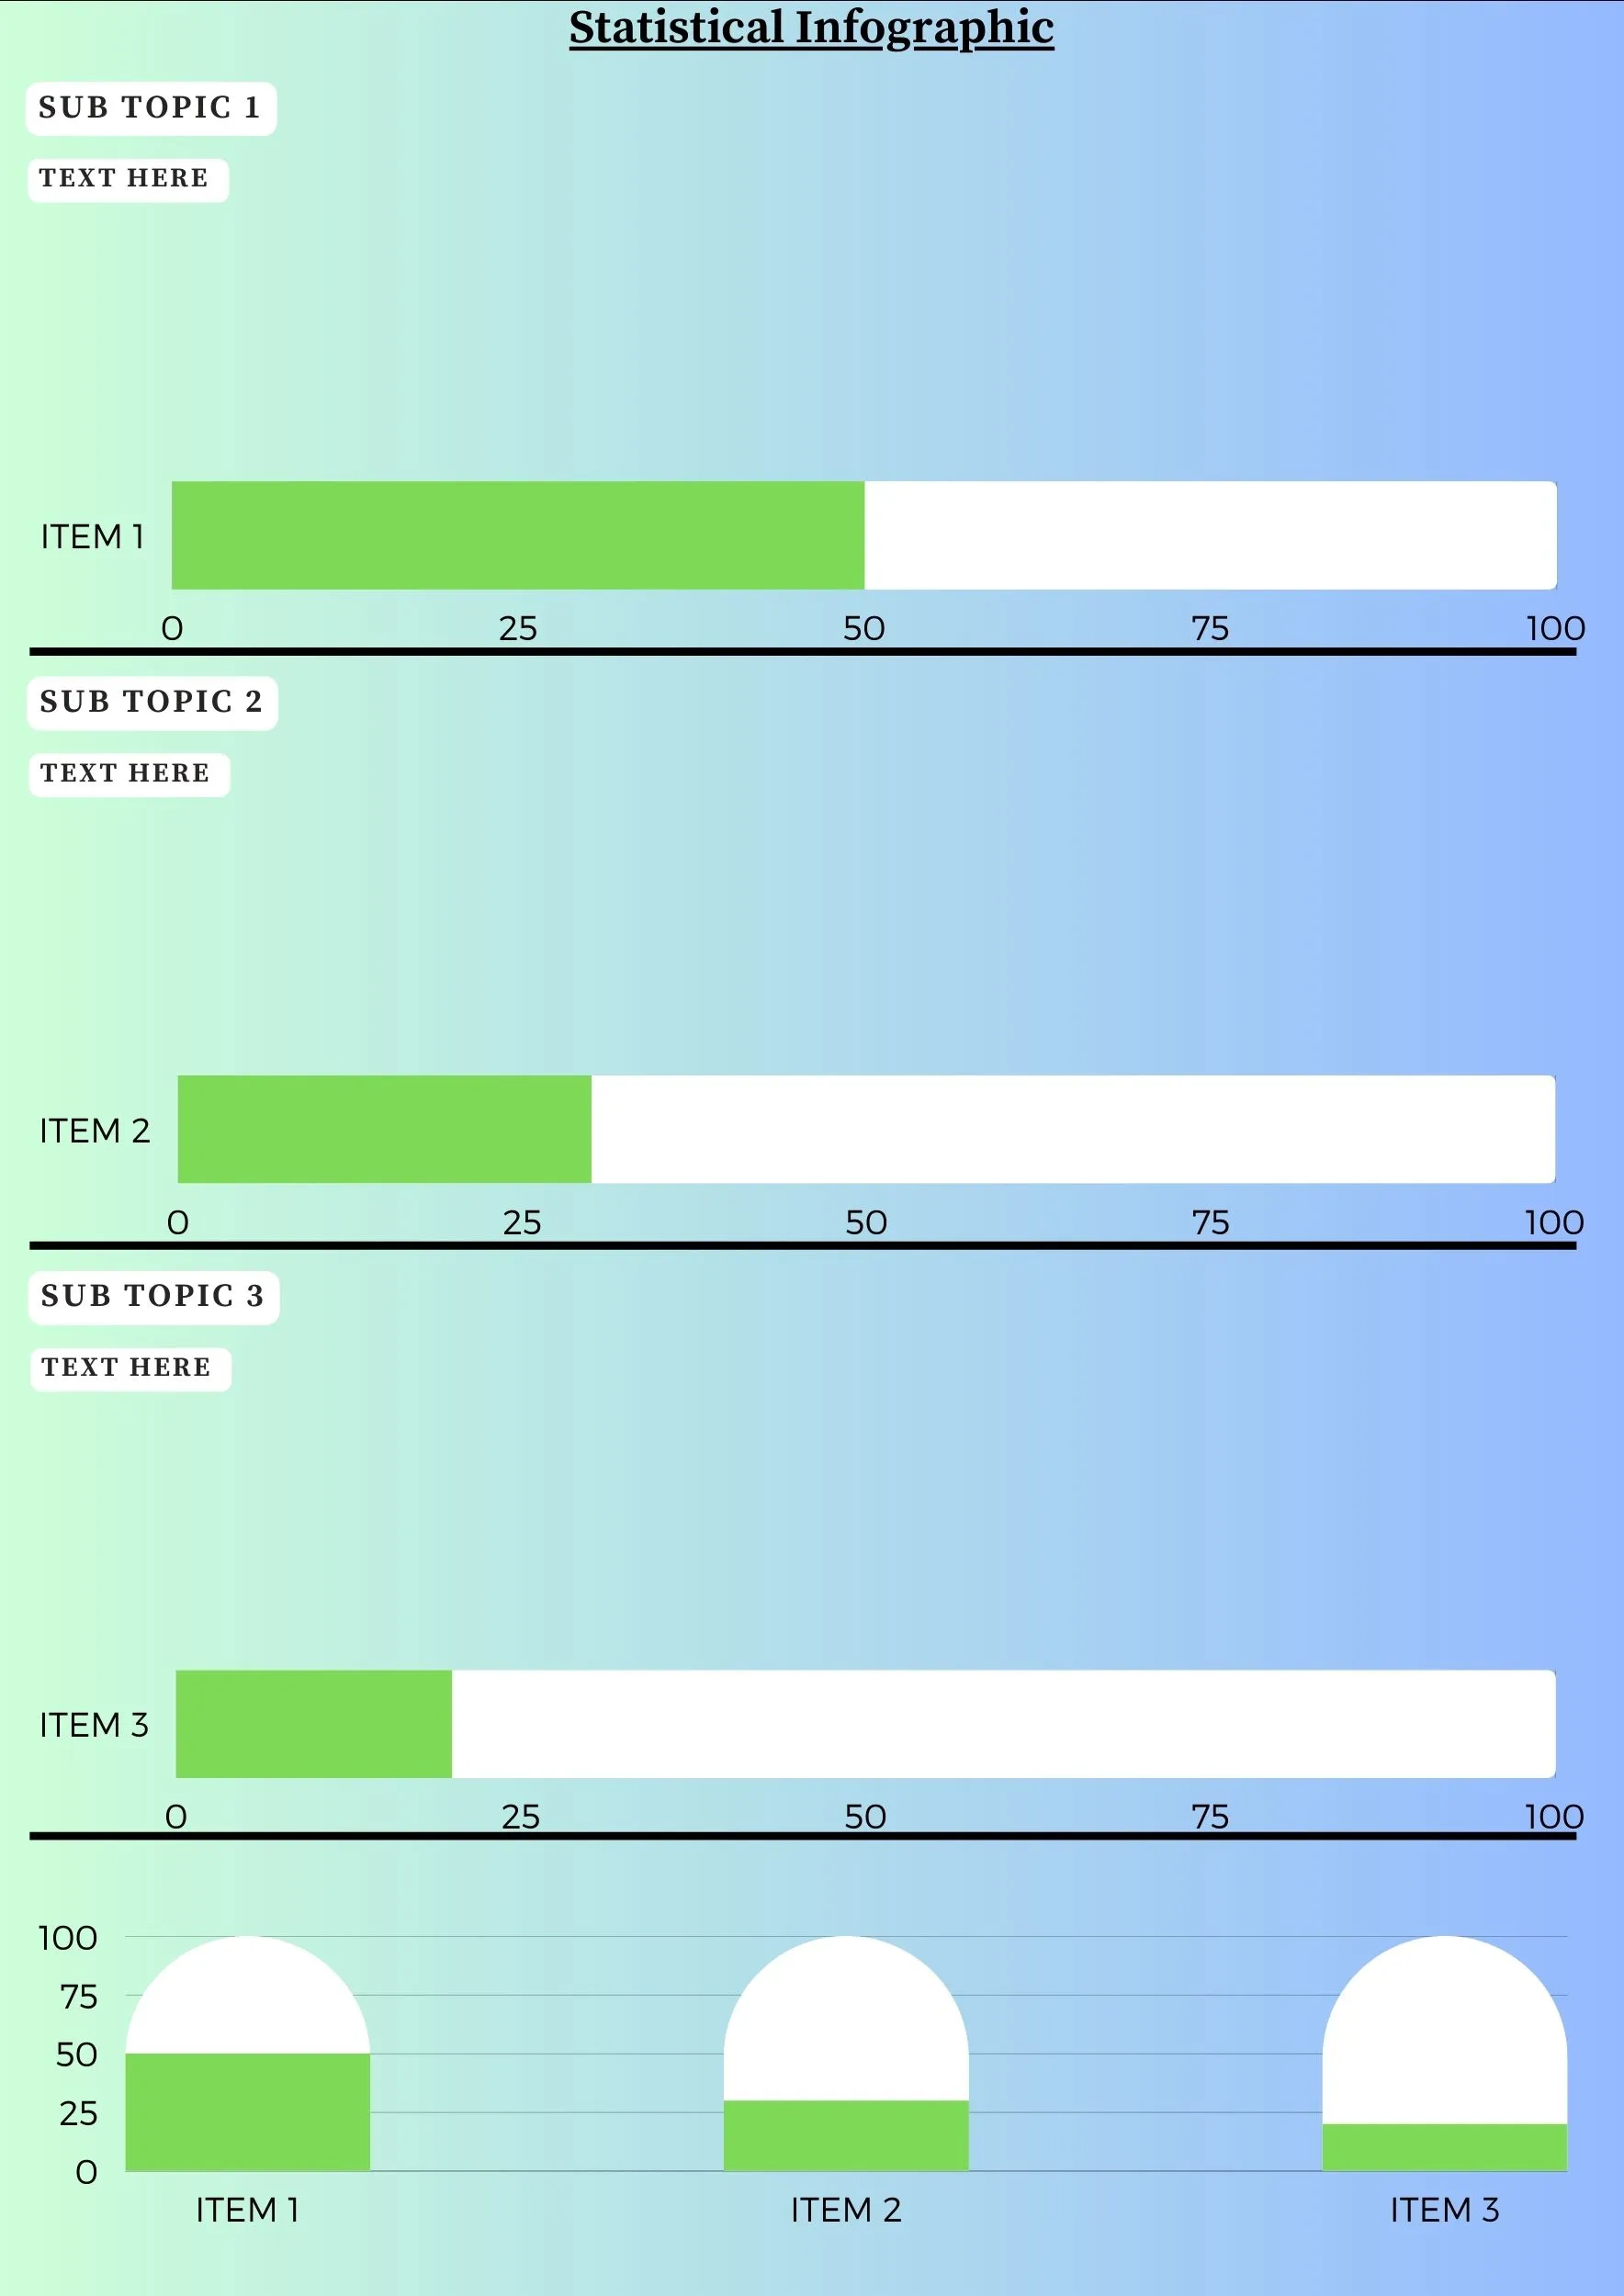
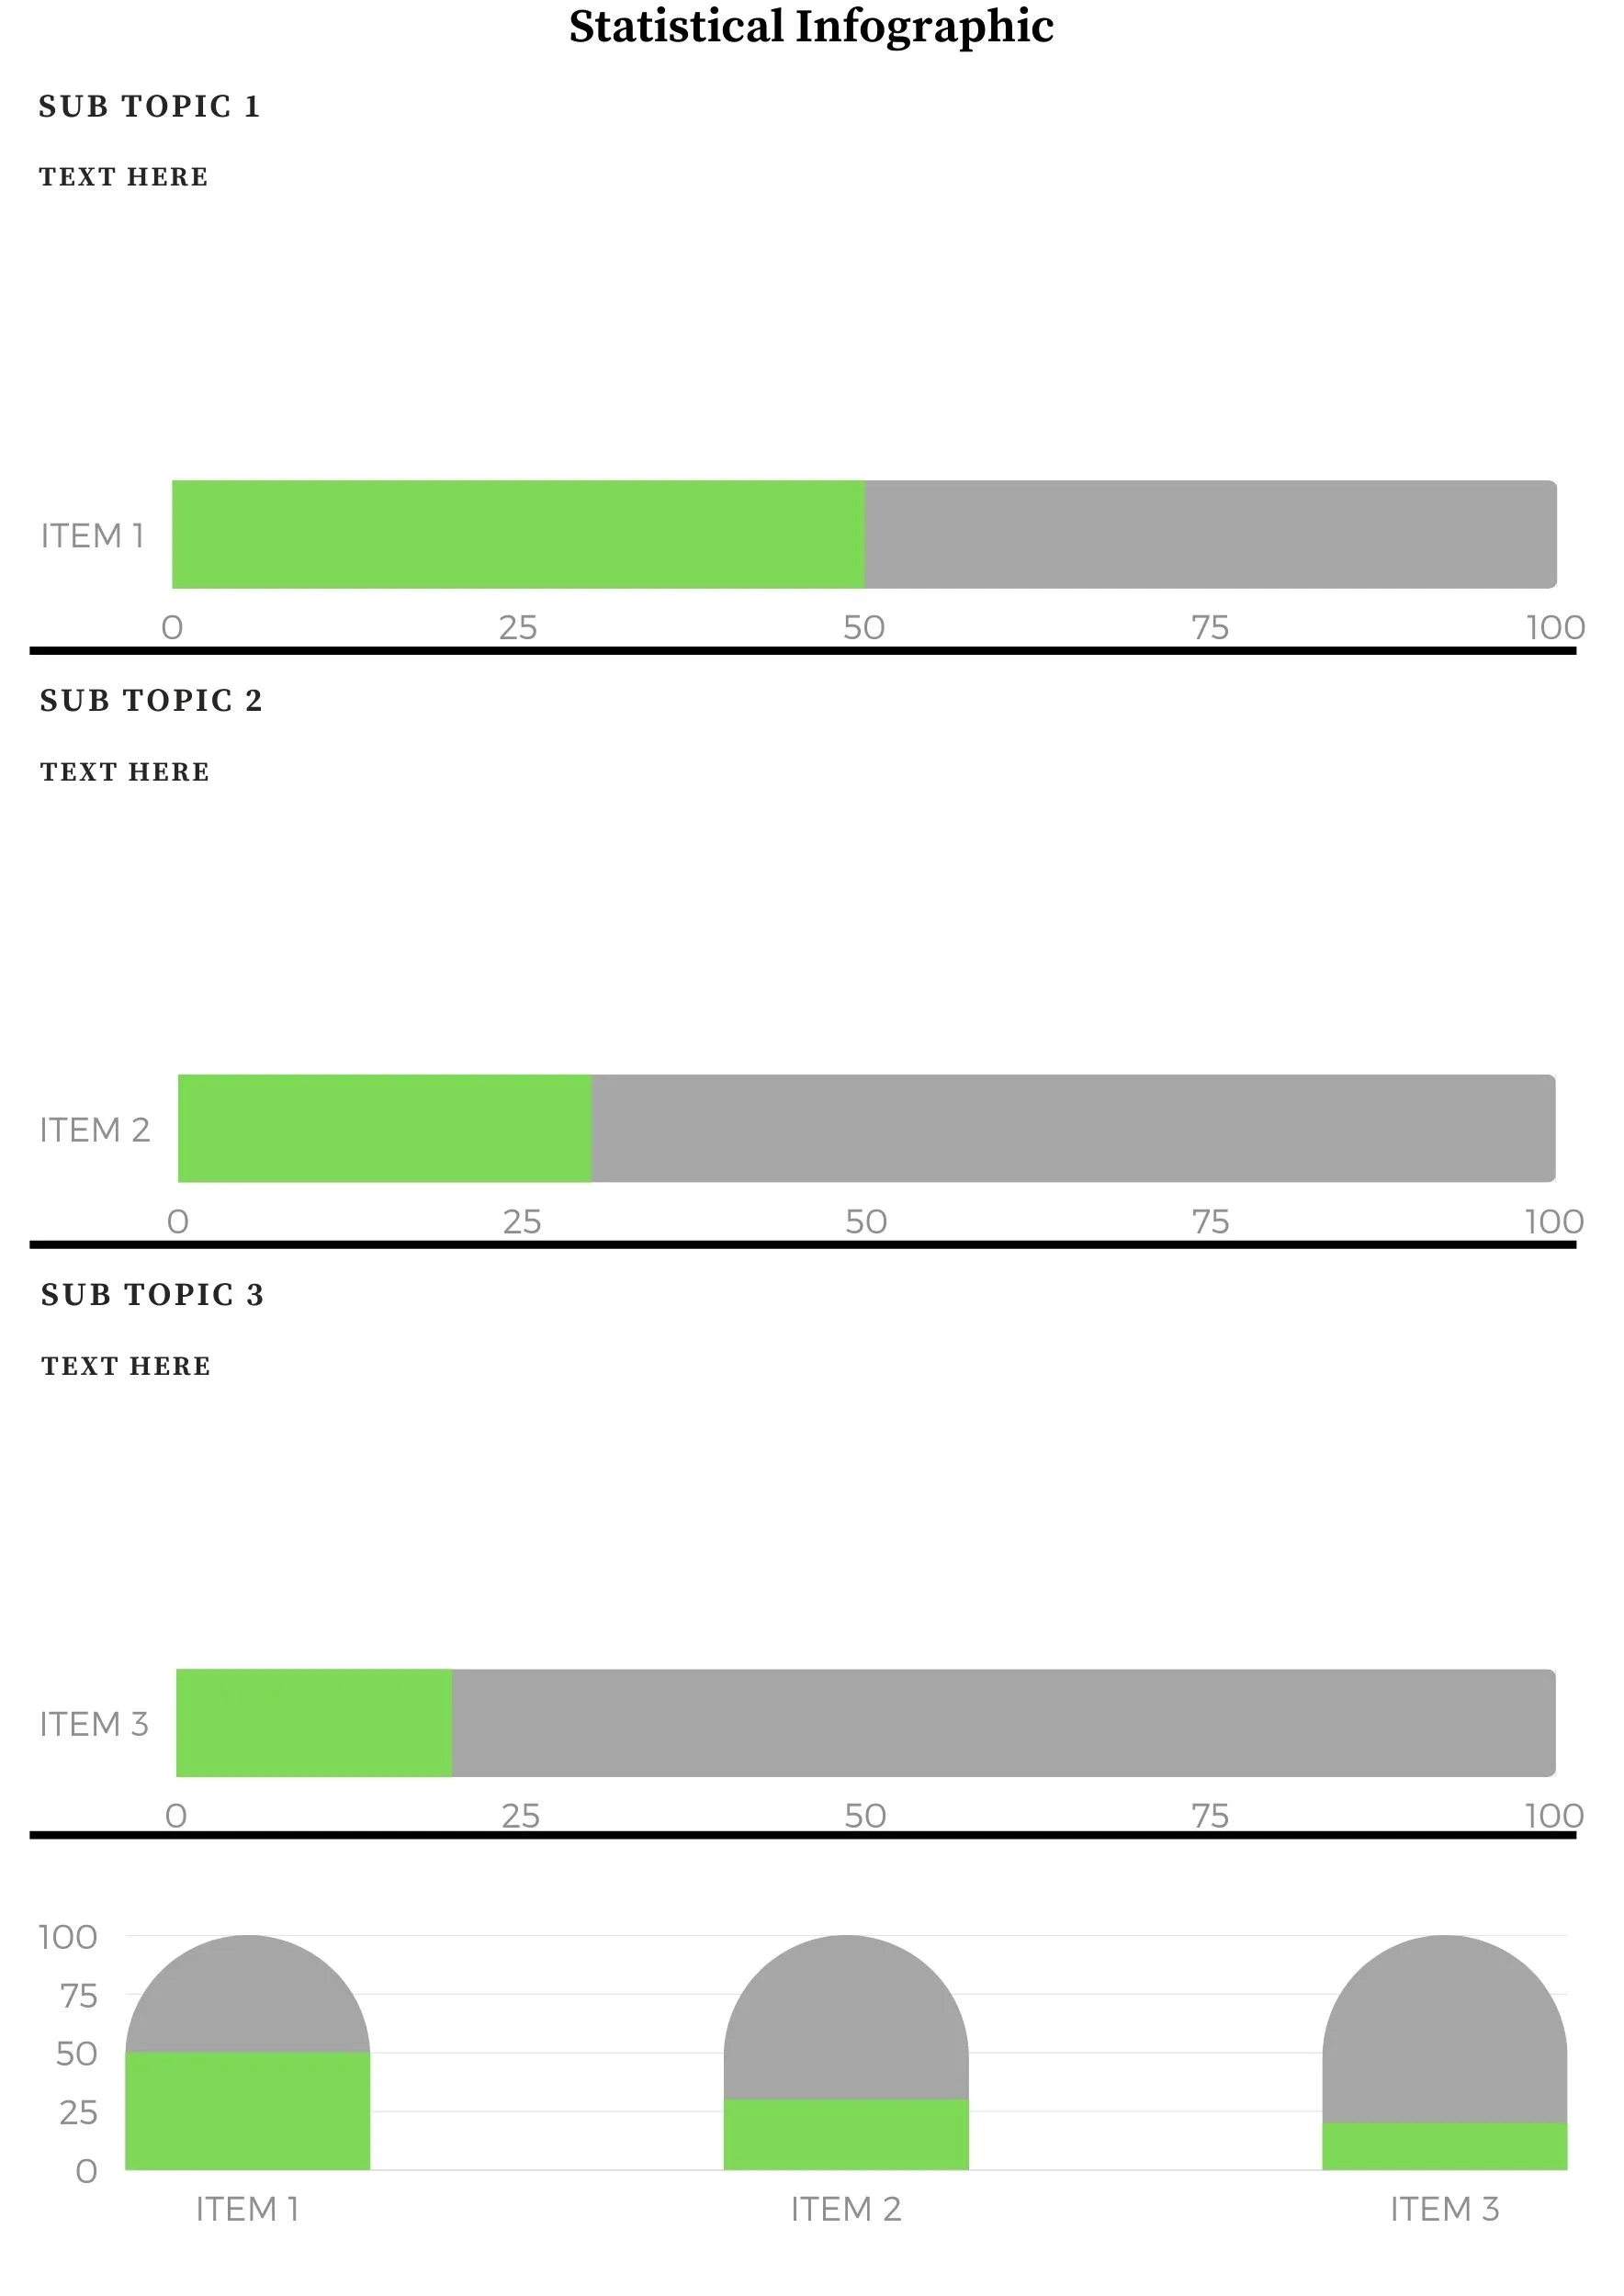
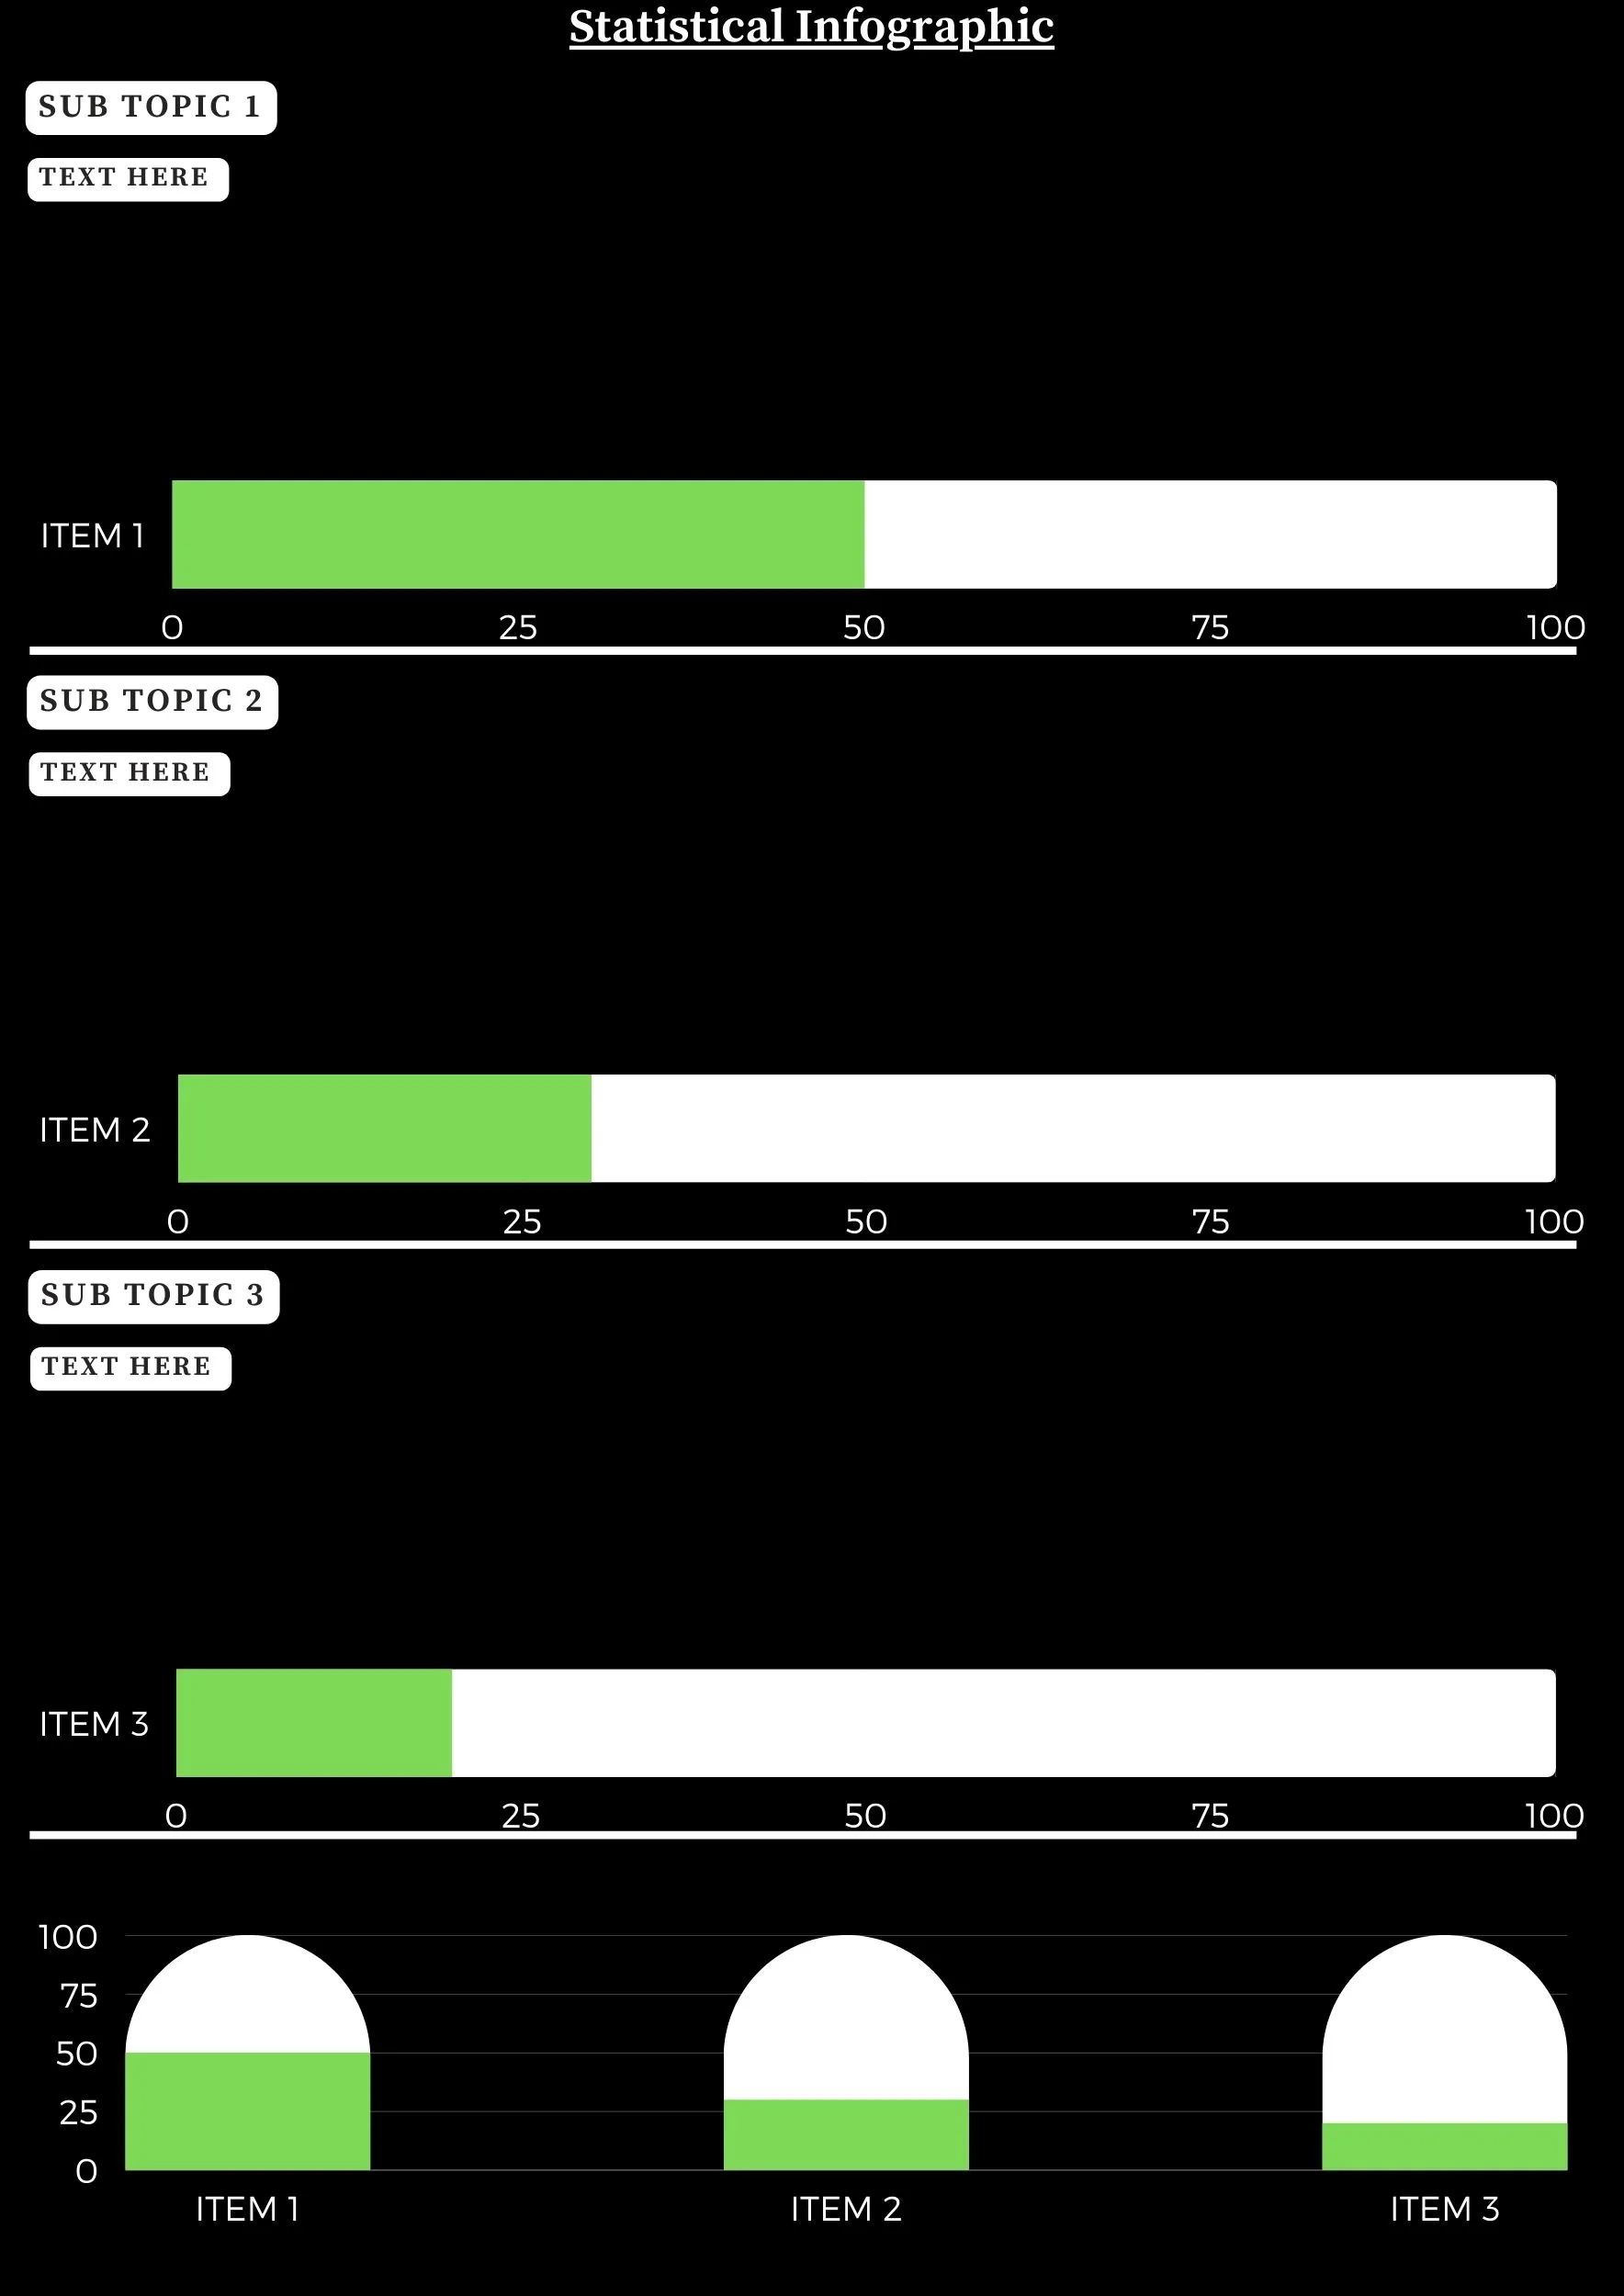
Statistical / Mixed chart
statistical infographic template
statistical infographic template
statistical infographic template
Are you looking to present your data in a more impactful way? Statistical / Mixed charts are the perfect solution for you! Not only do these charts provide a visually appealing way to display your data, but they can also provide valuable insight into trends, correlations, and other patterns in the data.
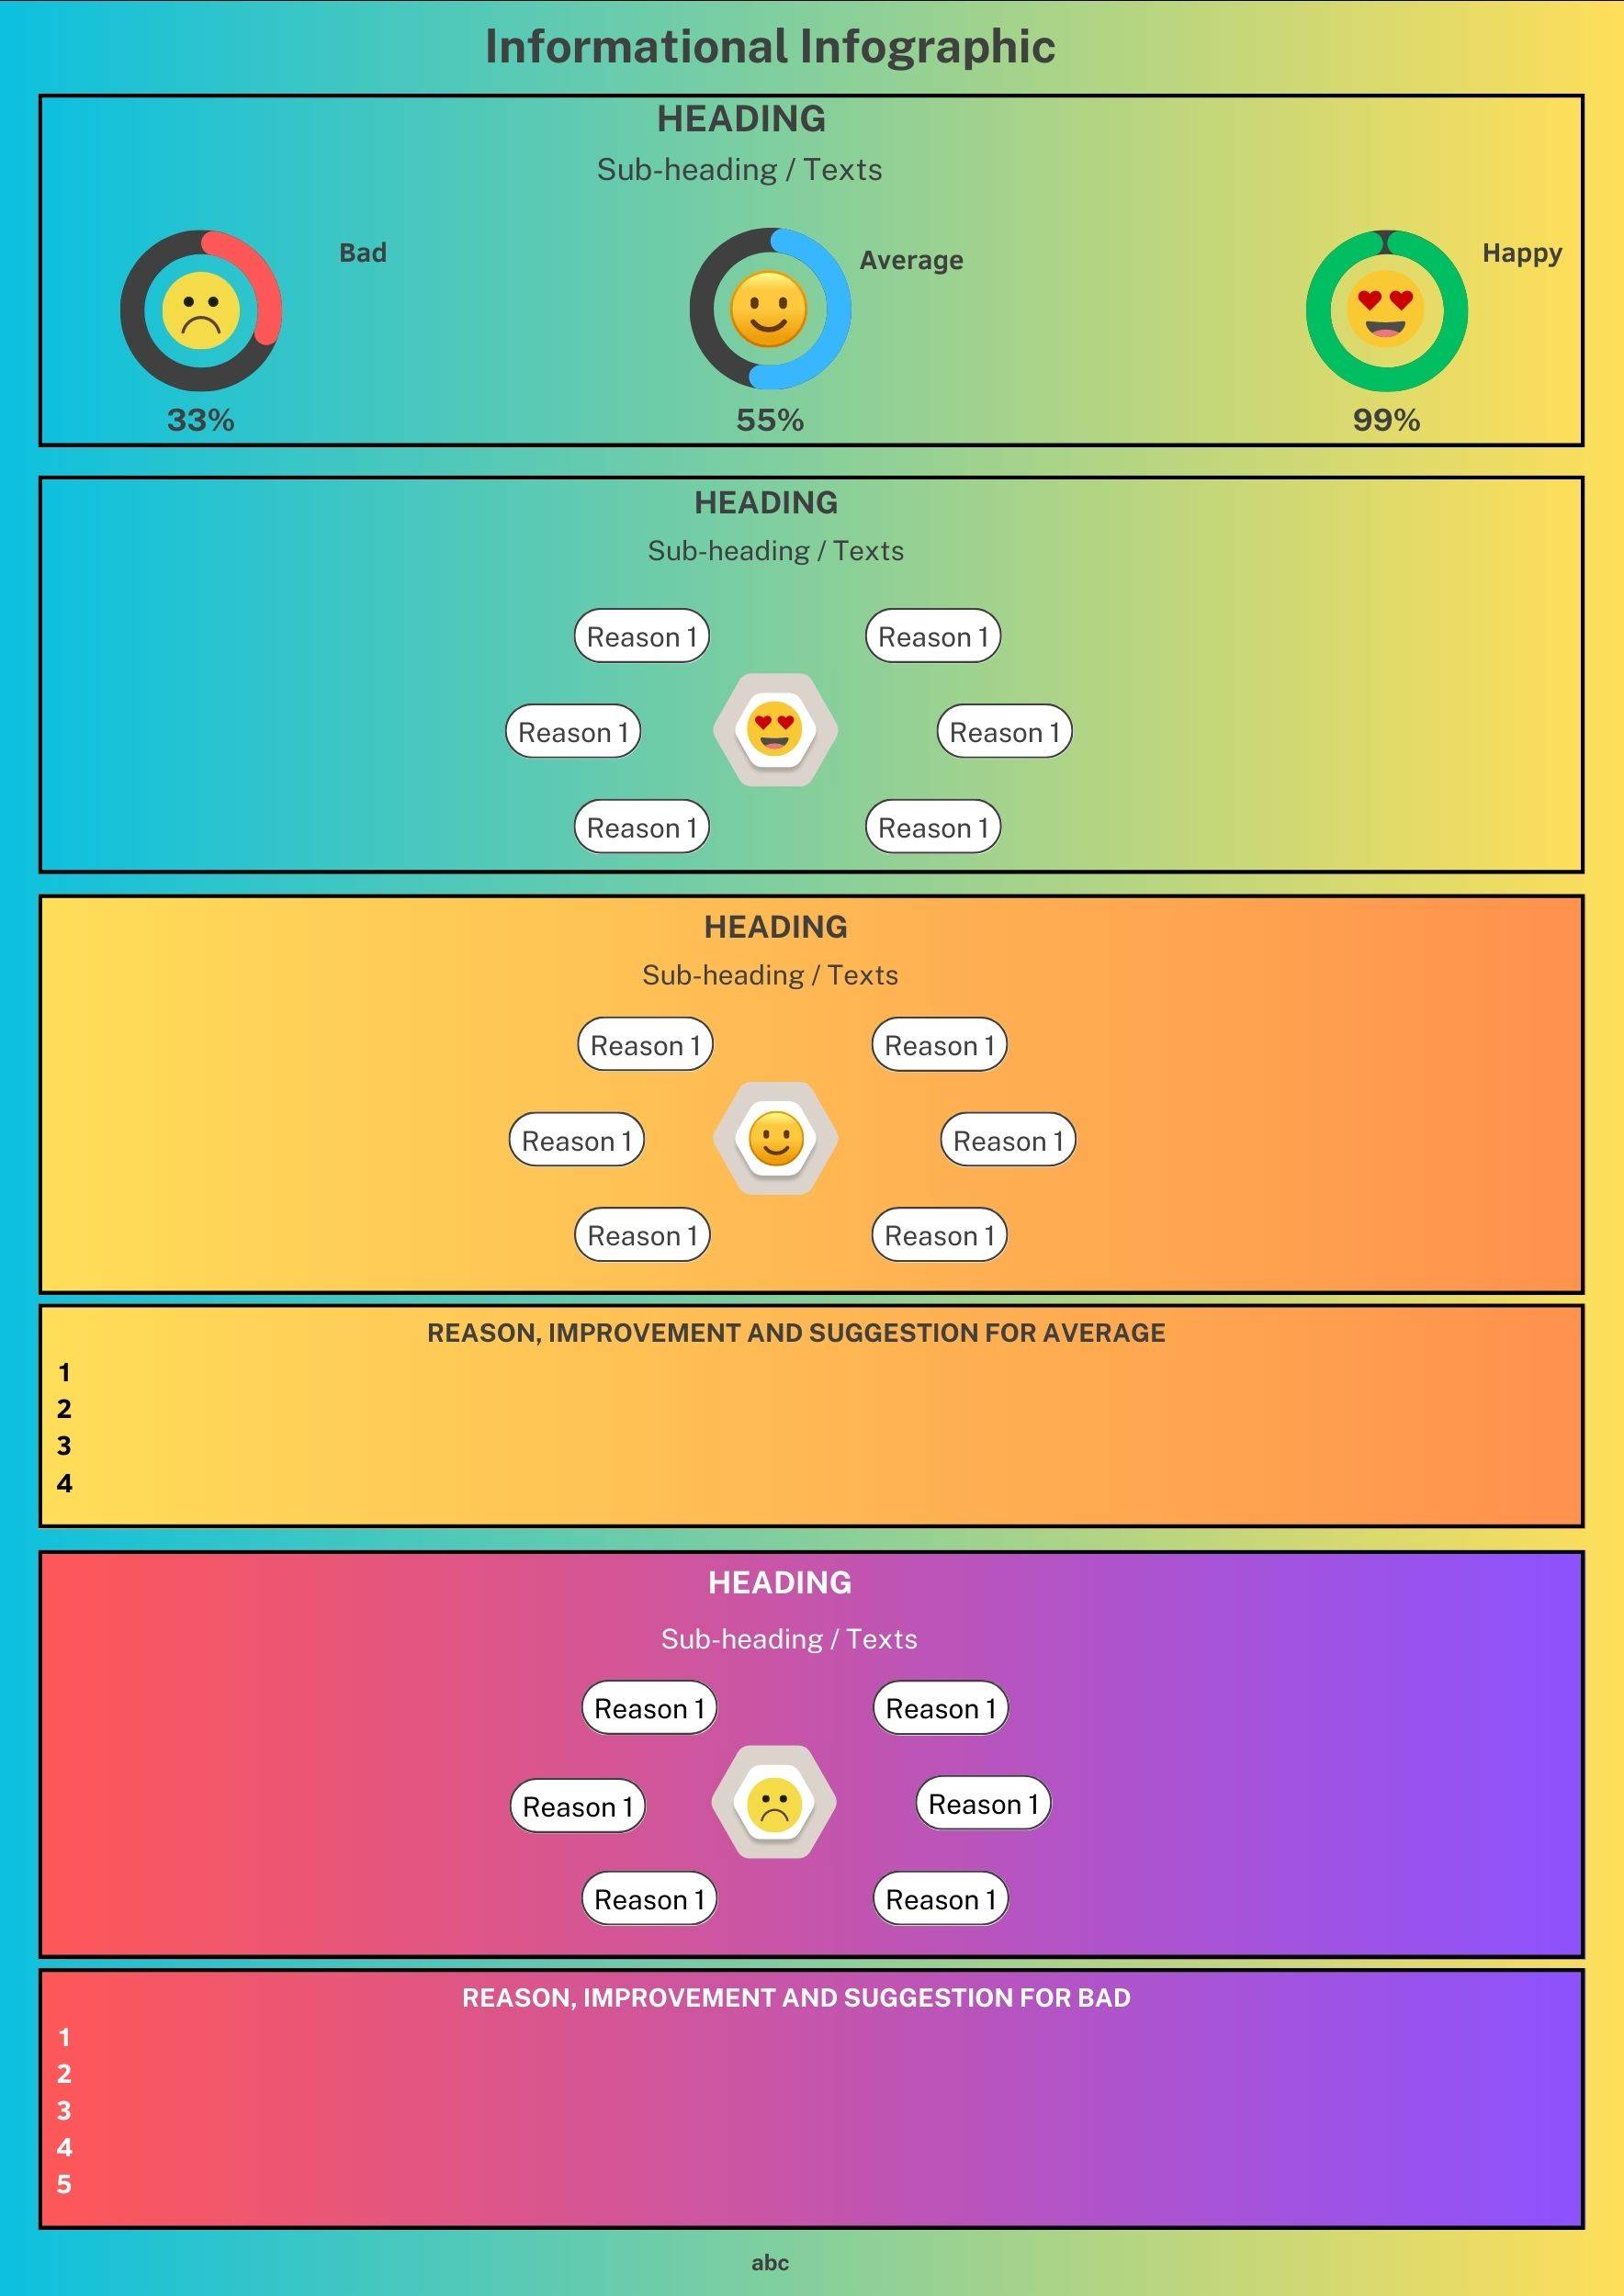
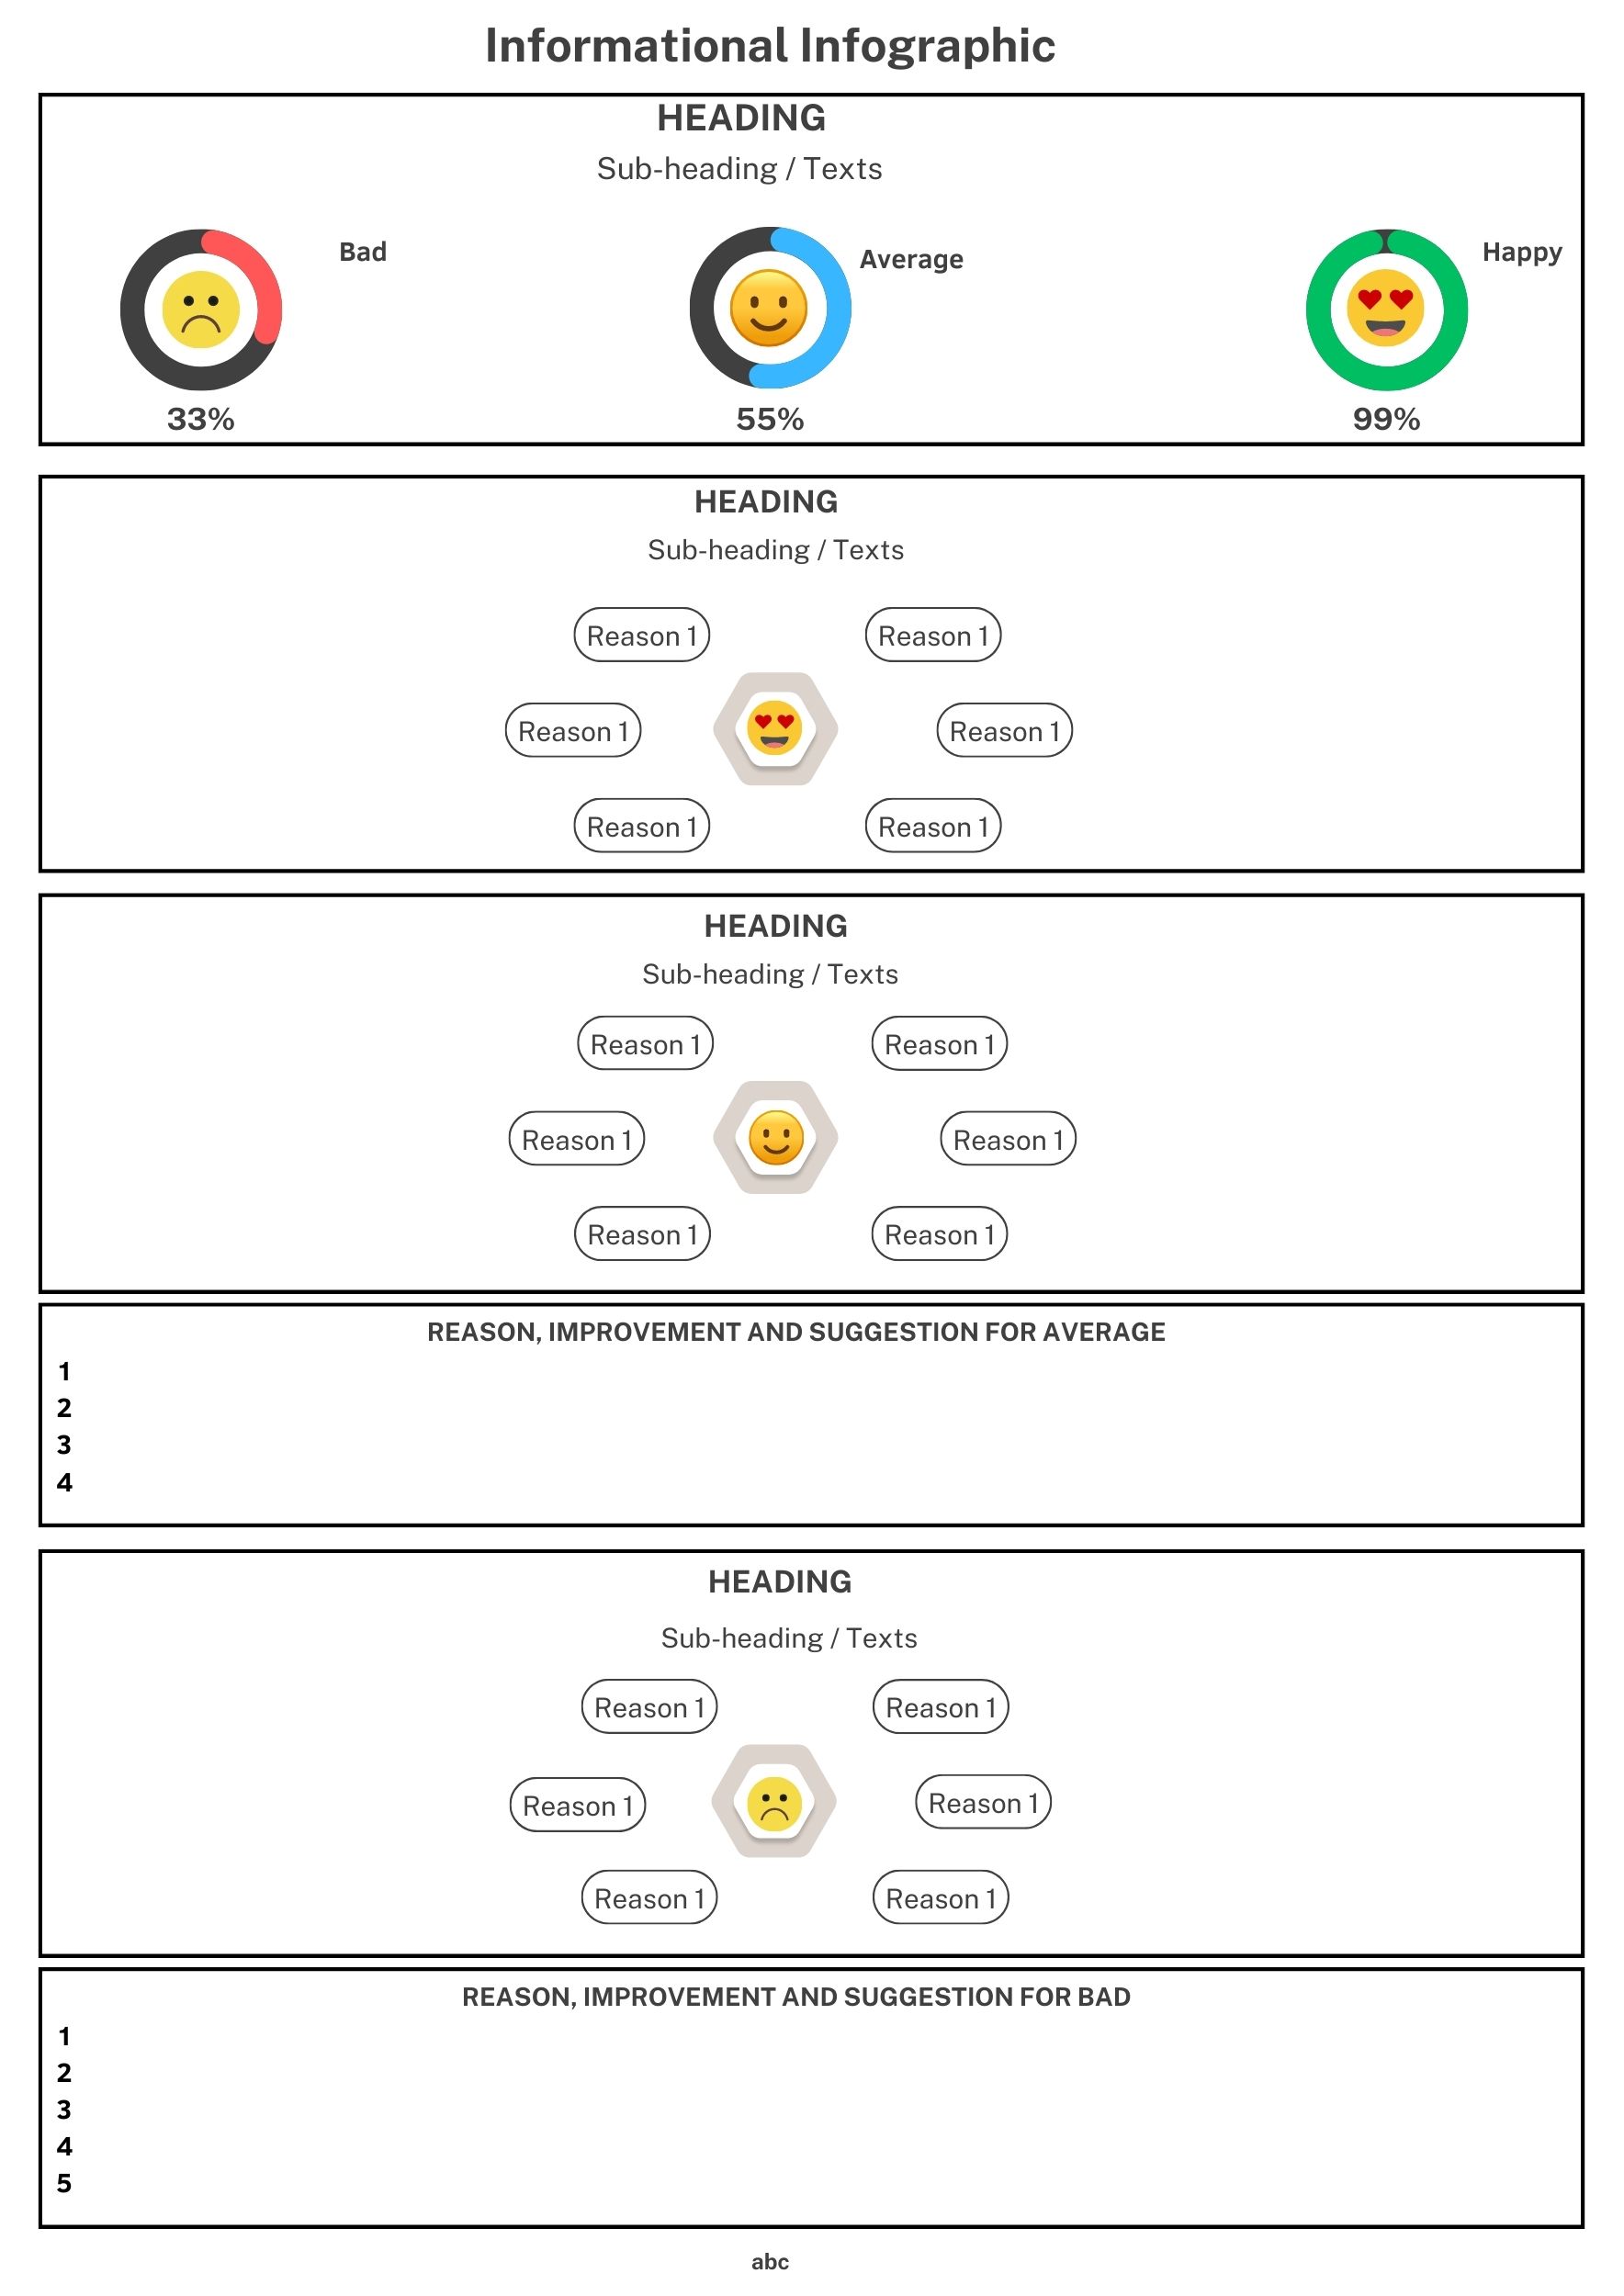
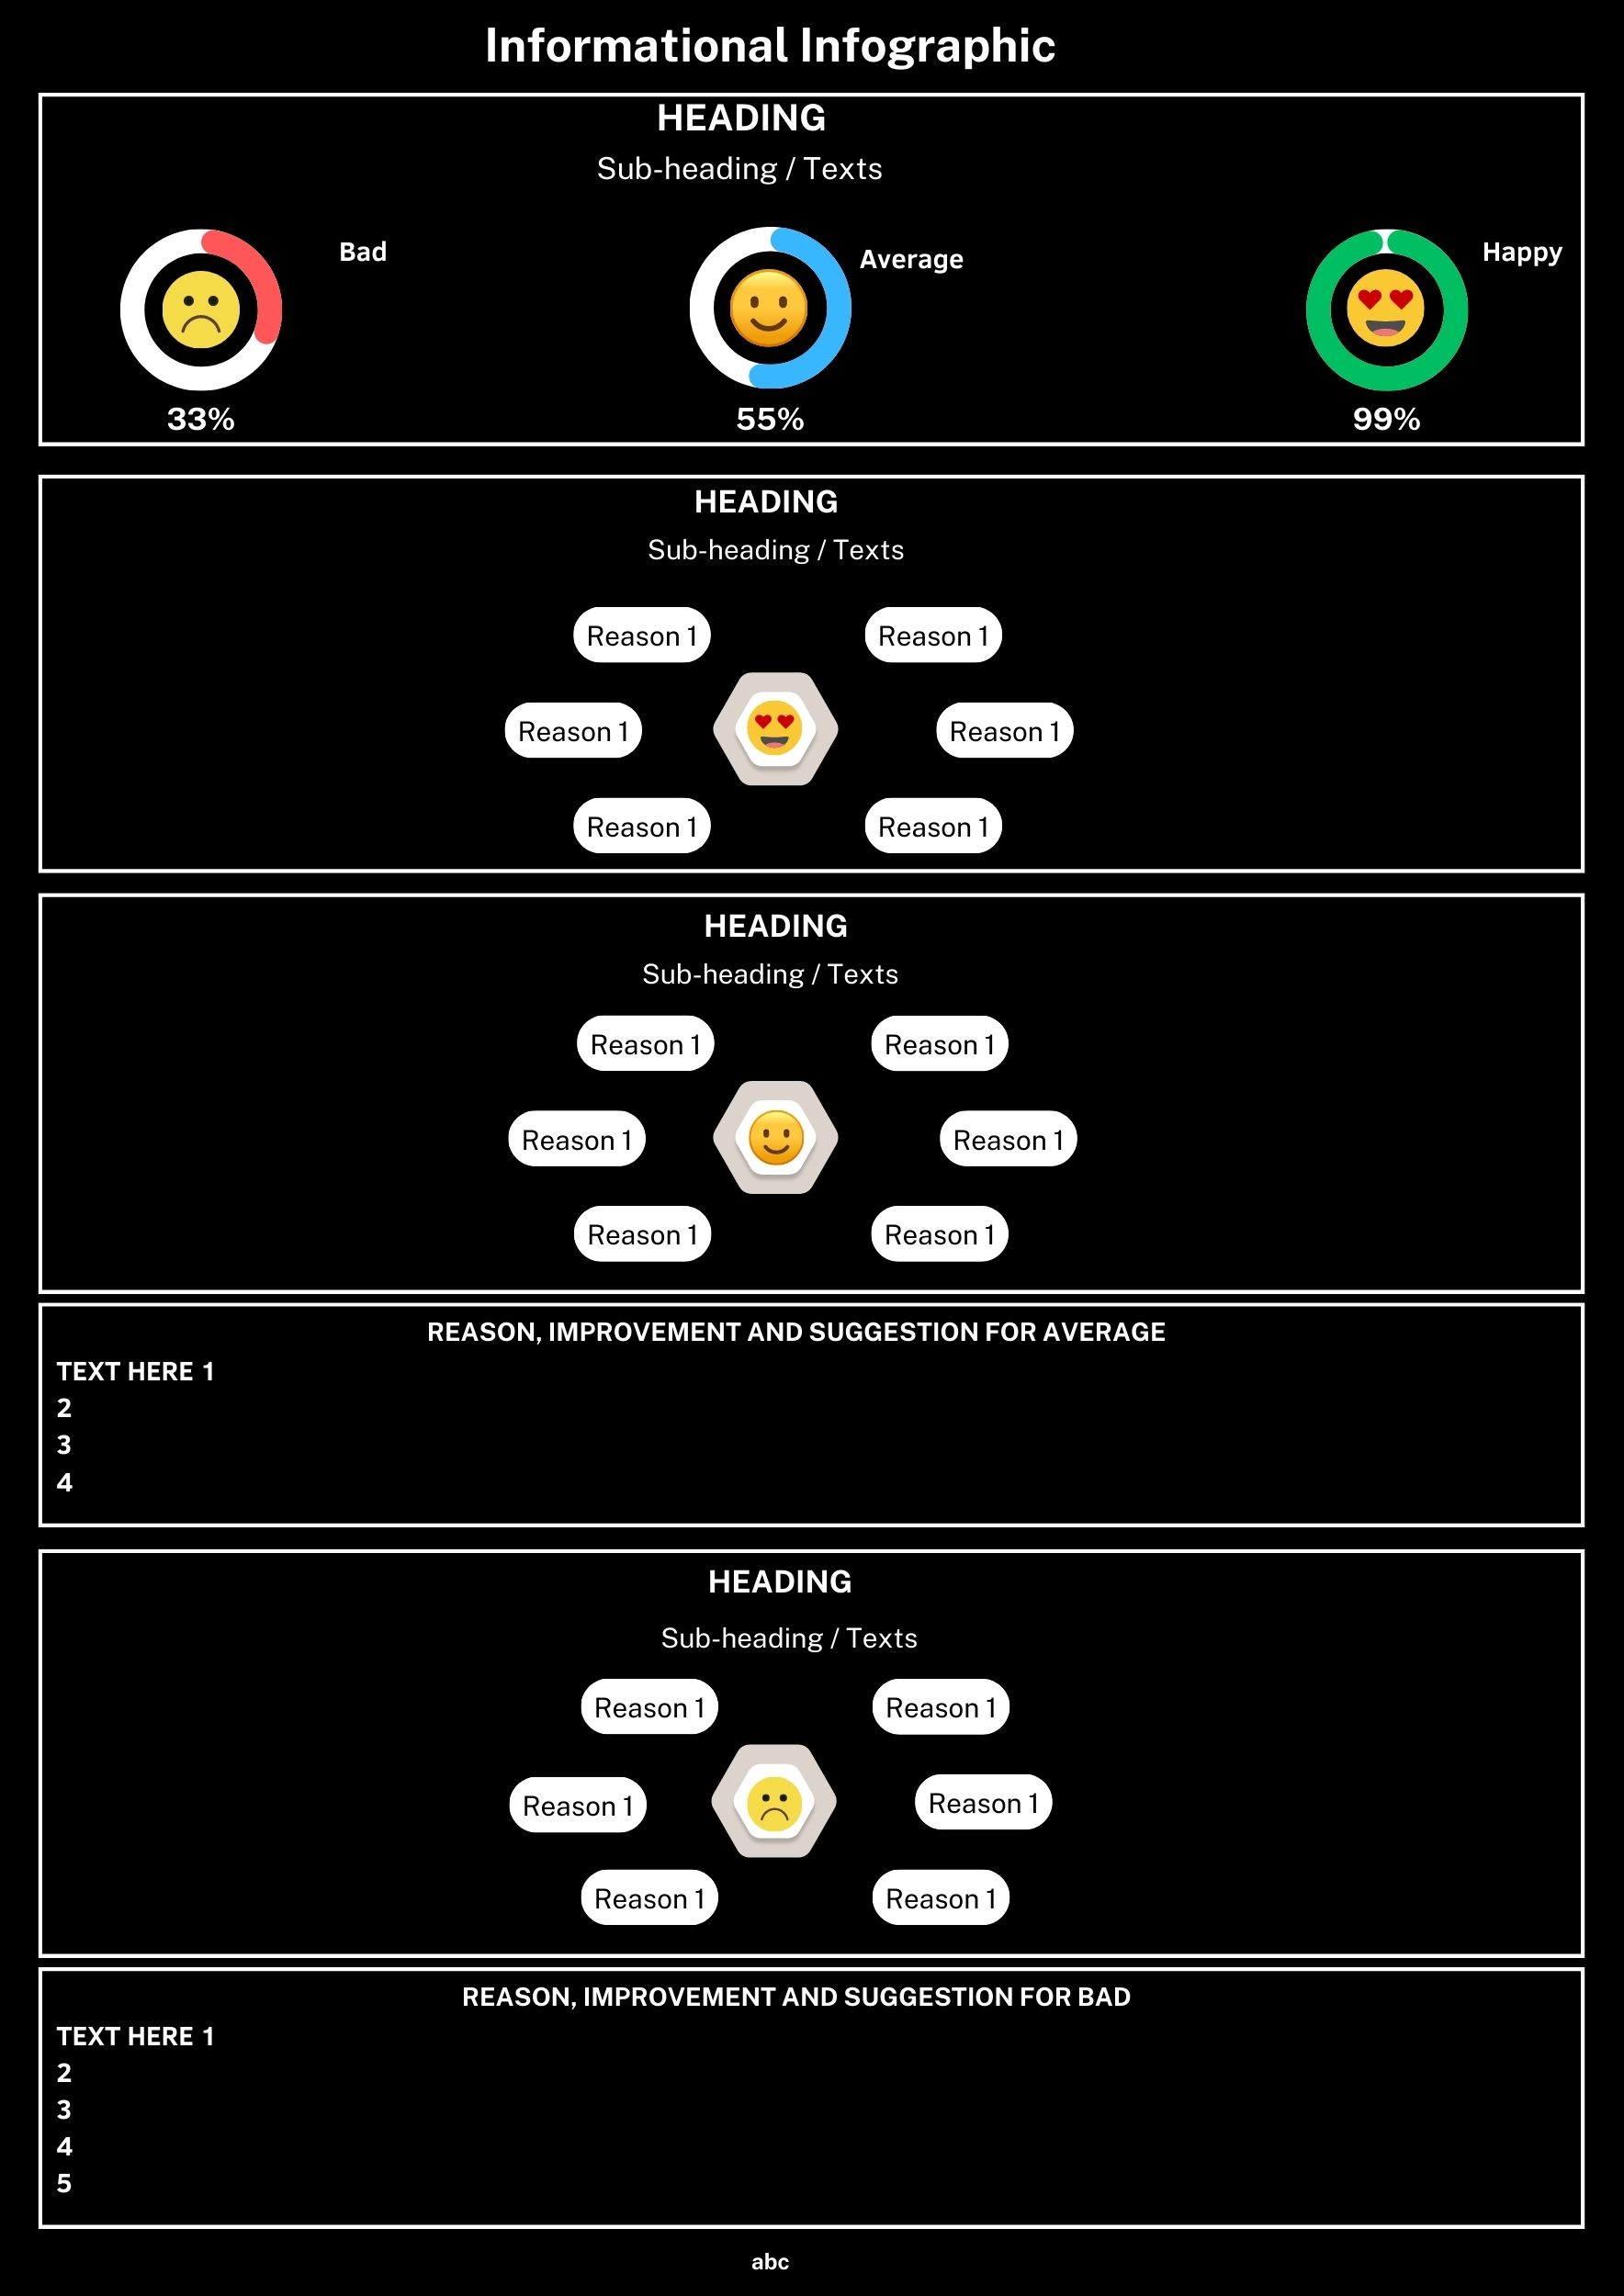
A list infographic, or an informational infographic, is a type of infographic that is popular for presenting information in a visually appealing and consumable manner.
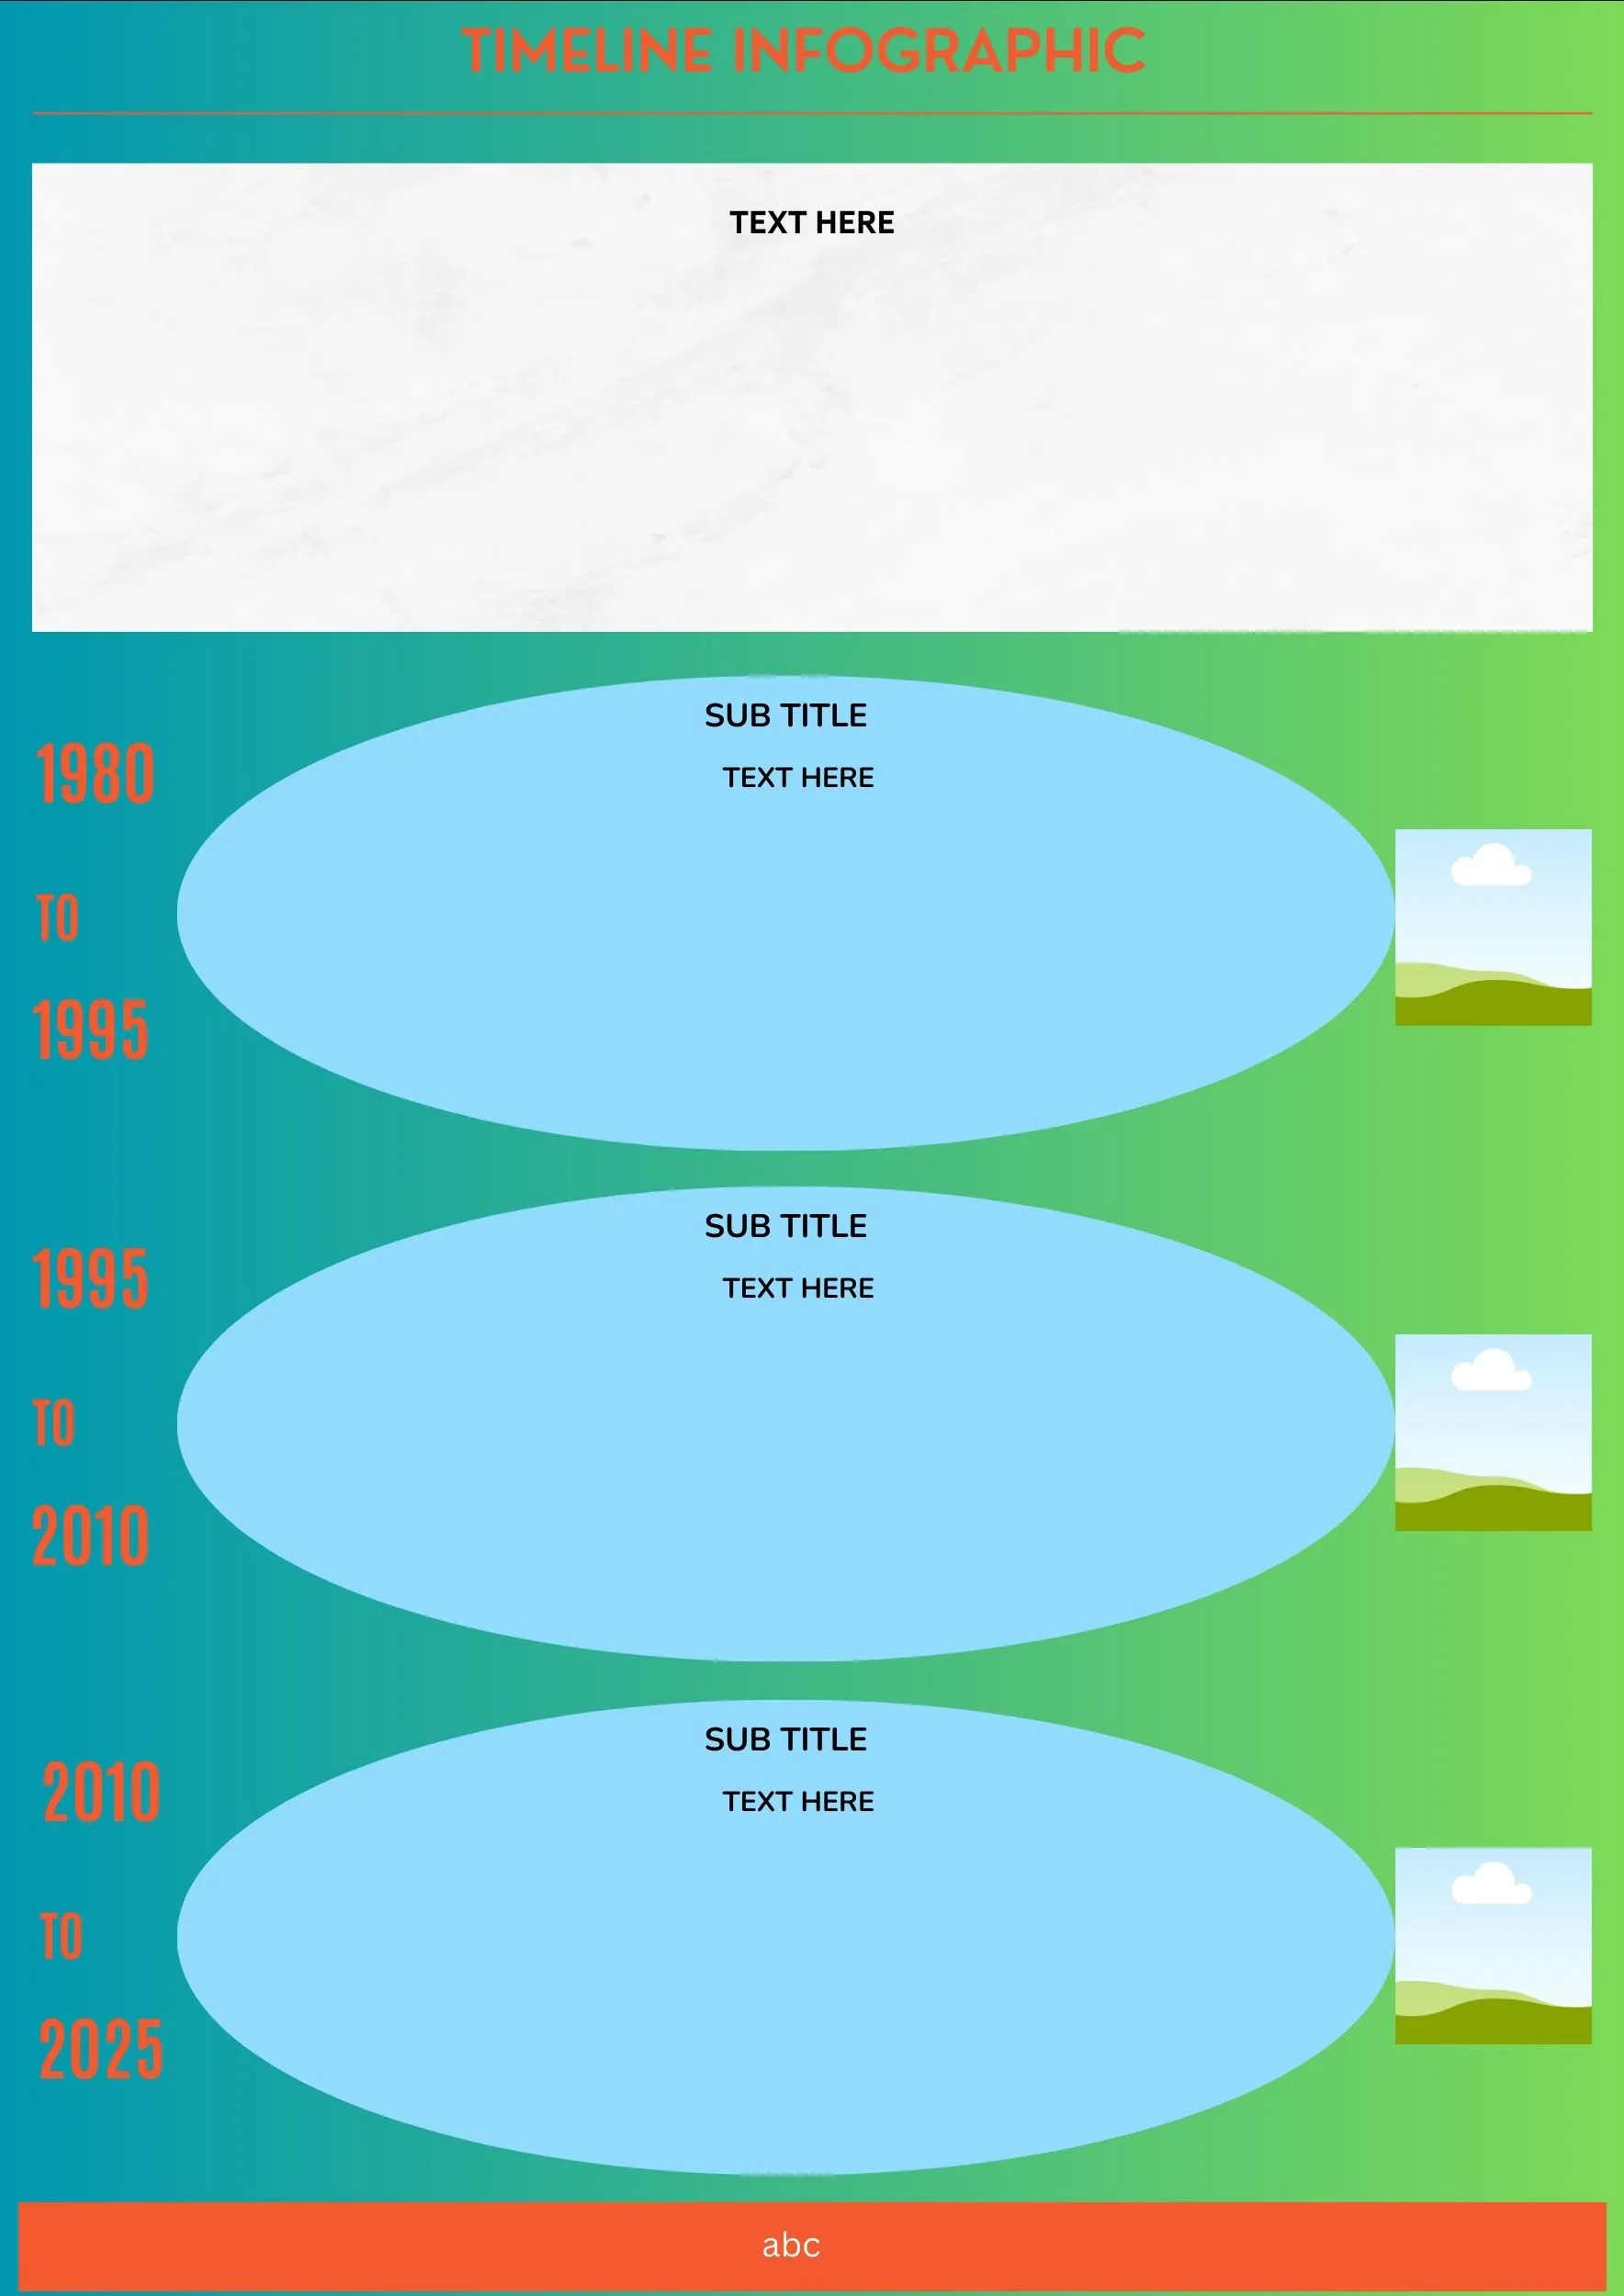
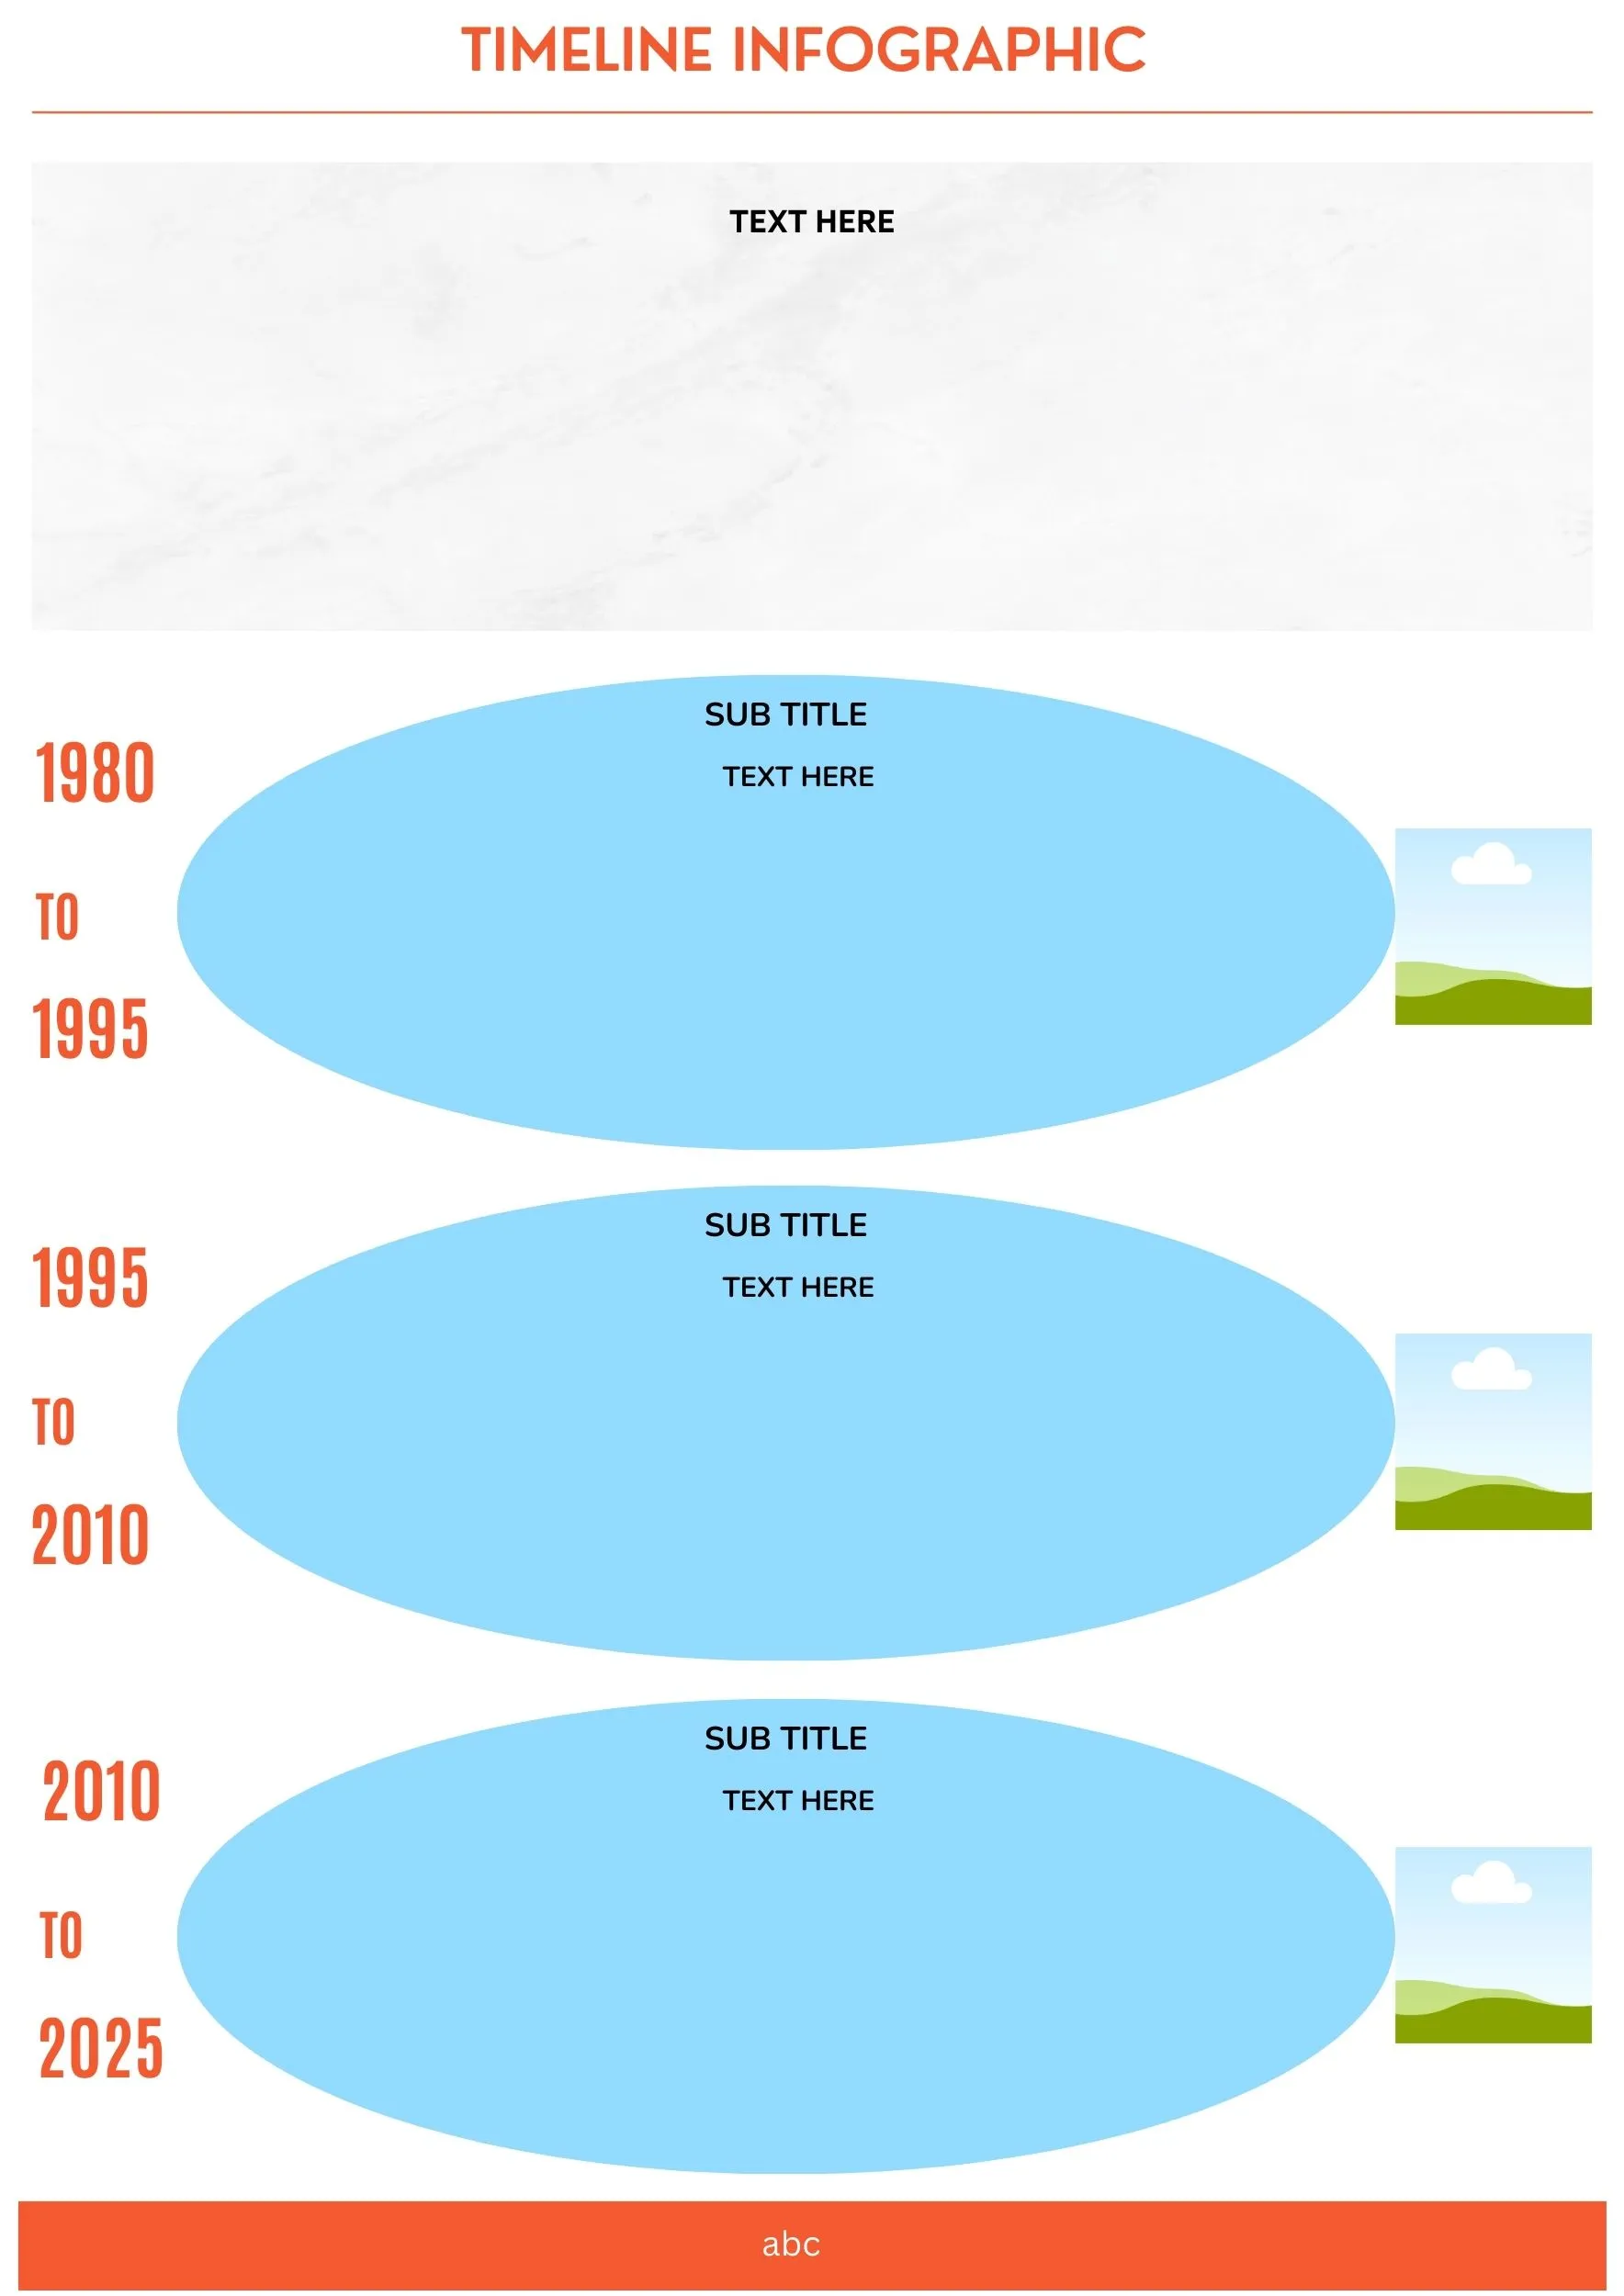
A timeline infographic template is a visual representation of events, processes, or projects that have occurred over a specific period. This template is used to organize and display information in chronological order to make it easier for viewers to understand the progression of events.
A guide infographic template is a type of infographic that presents information in a step-by-step format. It is designed to guide readers through a process or procedure, providing clear and concise instructions at each stage.
A process infographic template is a pre-designed layout that provides a framework for creating a process infographic quickly and easily. It helps you to organize your thoughts and ideas and present them in a clear and concise way.
A comparison infographic template can be a valuable tool for creating engaging and informative infographics quickly and easily. These templates typically include pre-designed layouts, graphics, and icons that can be customized with your own data and information.
A location or map infographic template is a perfect example of this. It displays data related to geography, locations, and maps in a visually appealing
As humans, we tend to perceive the world around us visually. When it comes to data, it’s no different. That’s why, In location or map infographic template is a perfect example of this. It displays data related to geography, locations, and maps in a visually appealing way.
Flowchart Infographic is a graphical representation of a process or system, where steps are represented by symbols or shapes that are connected by lines or arrows. This visual tool is used to simplify complex concepts and make them more understandable.
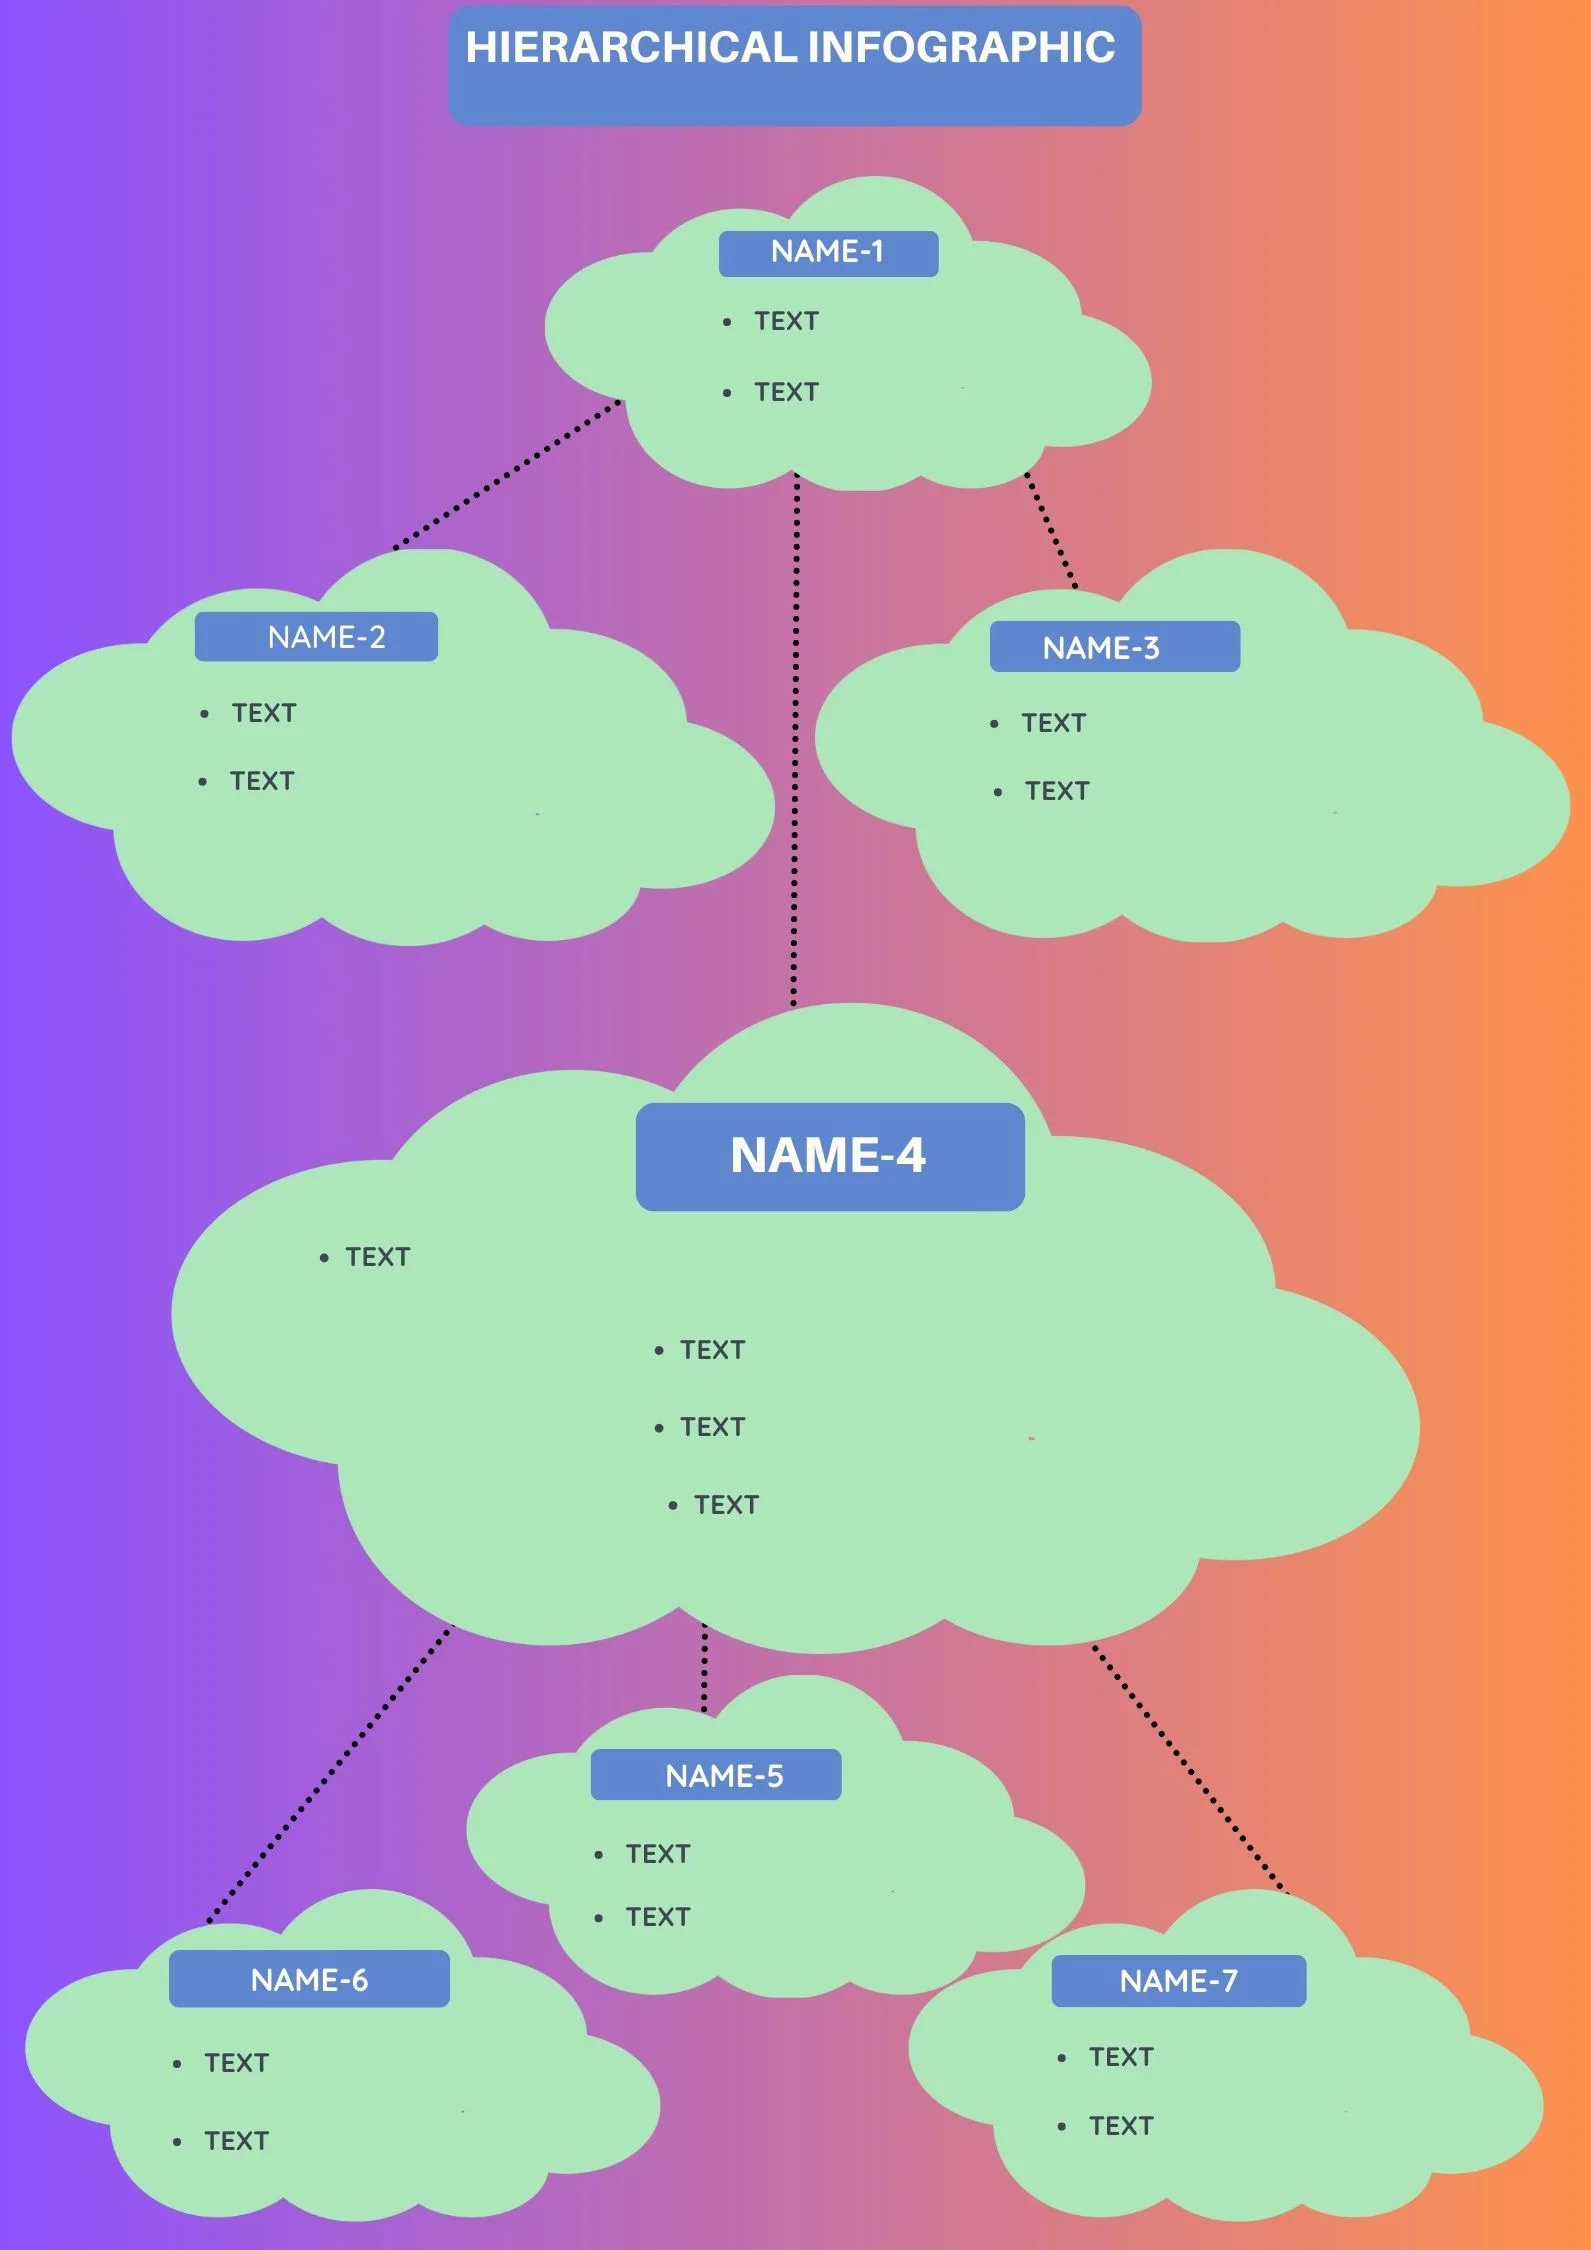
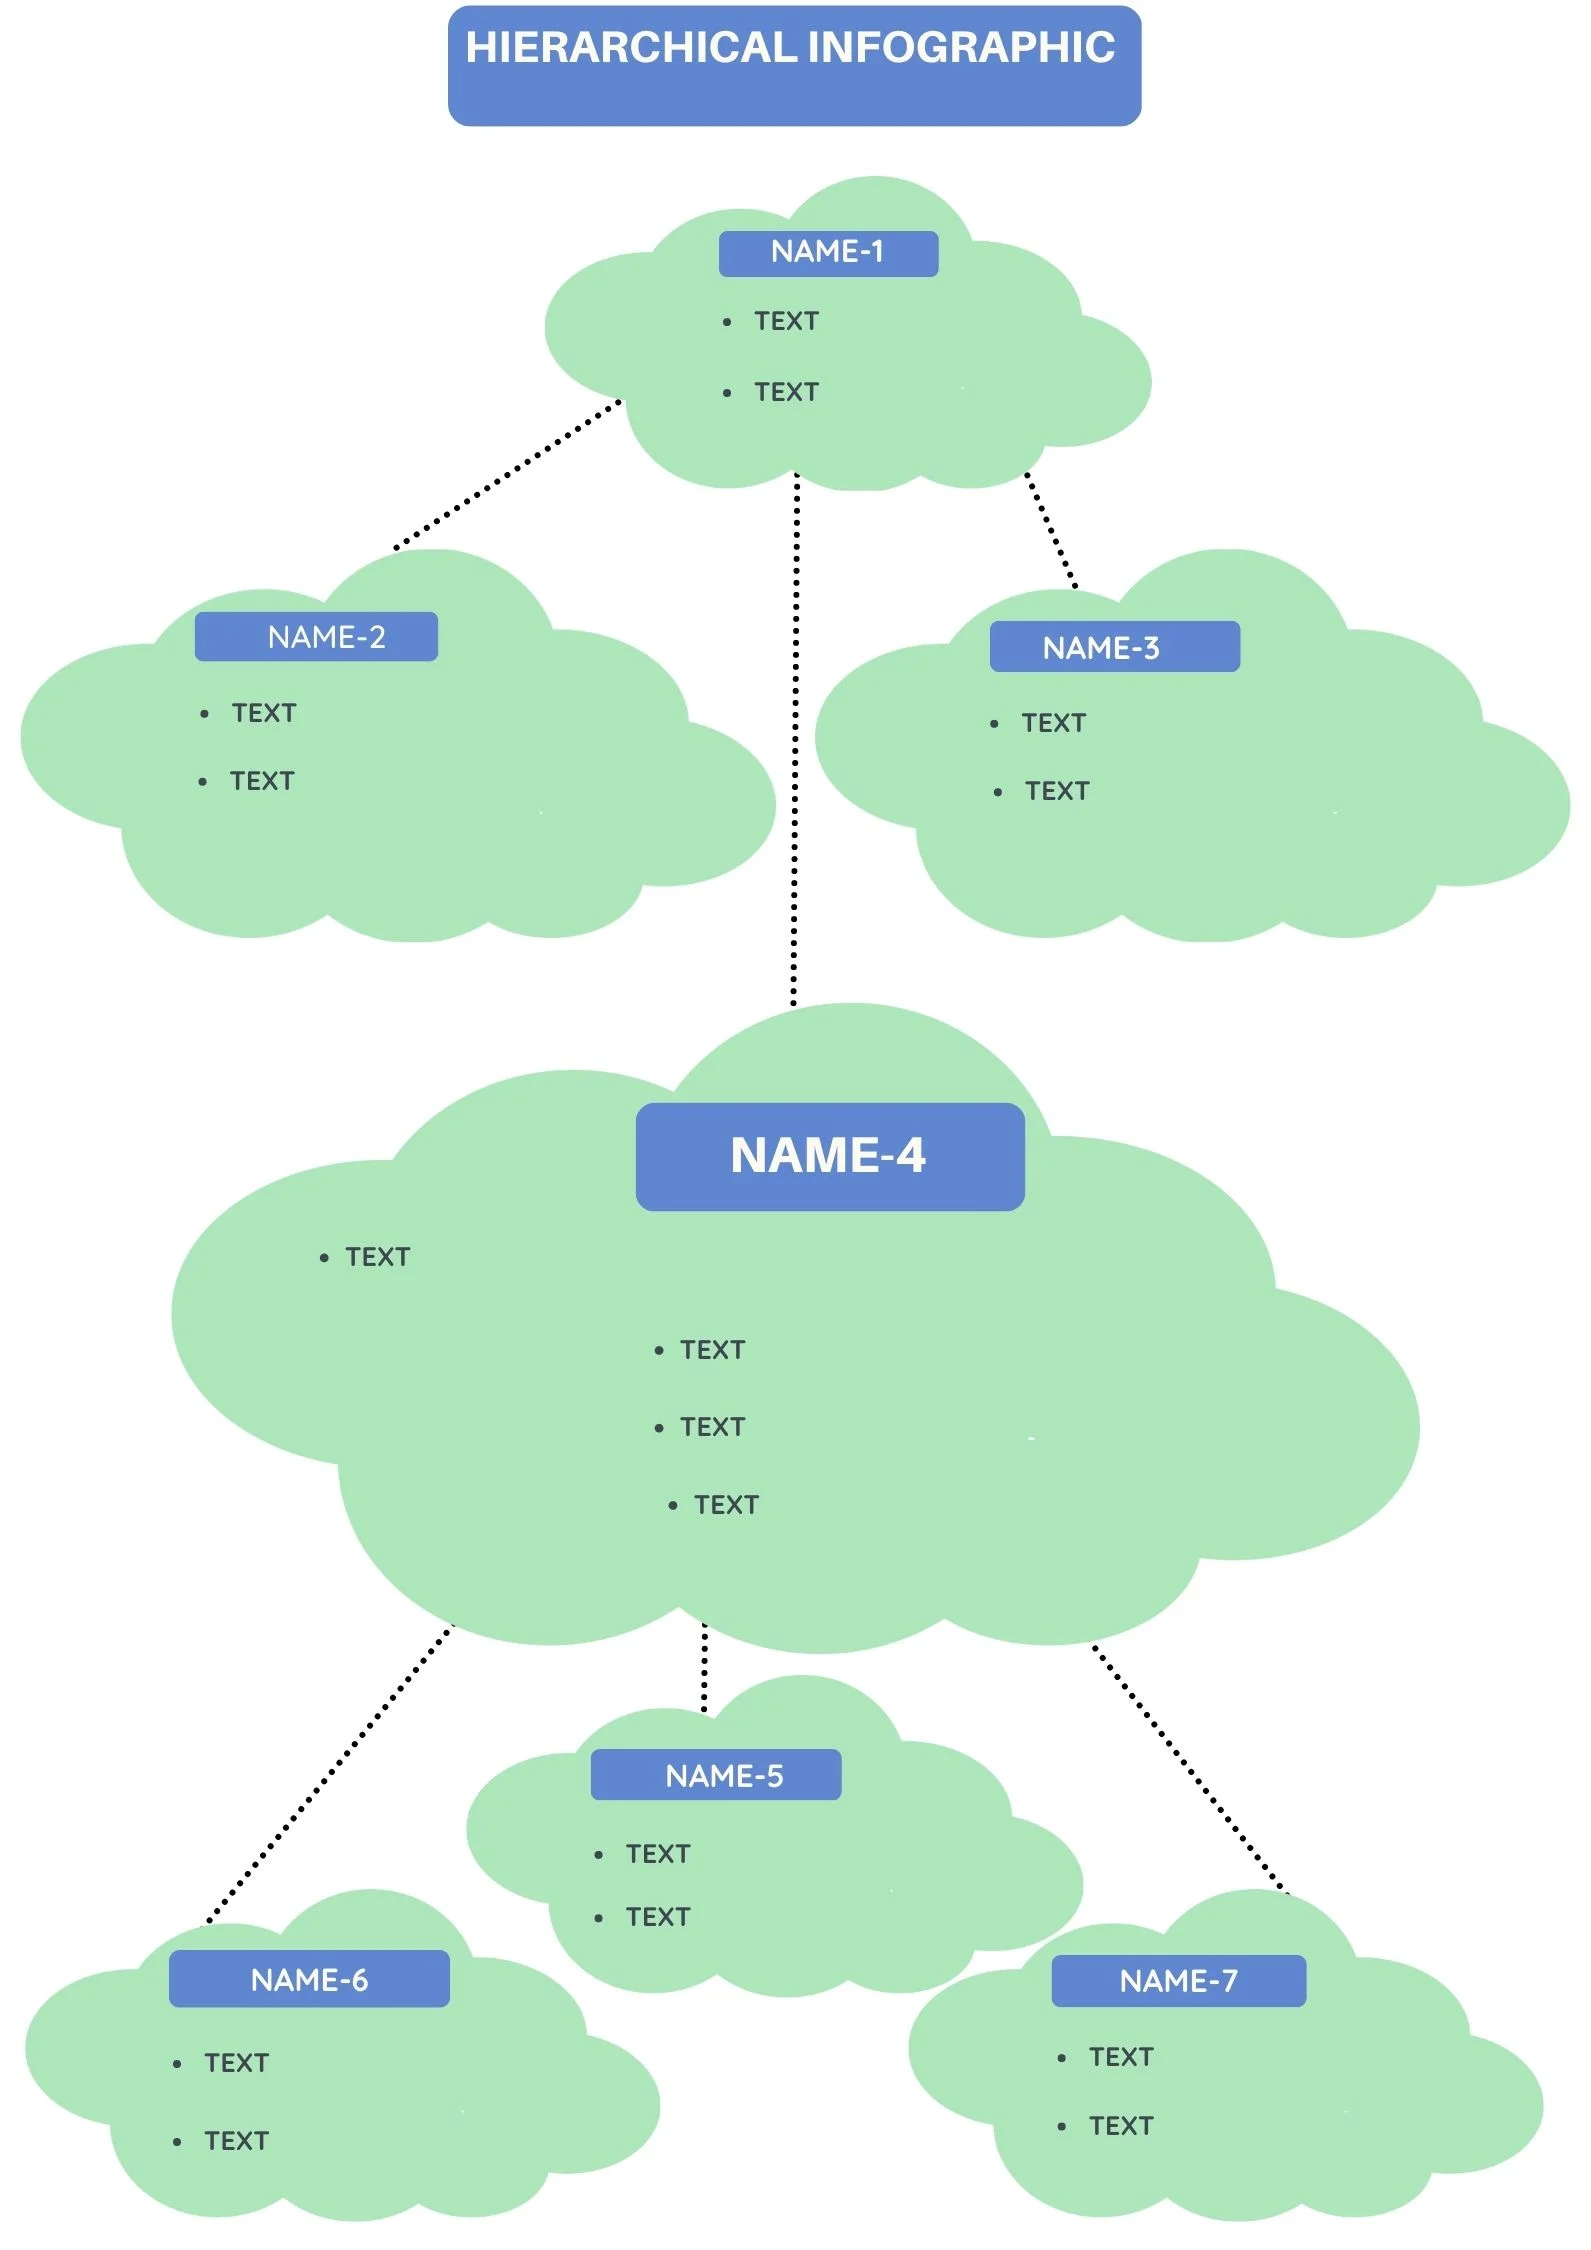
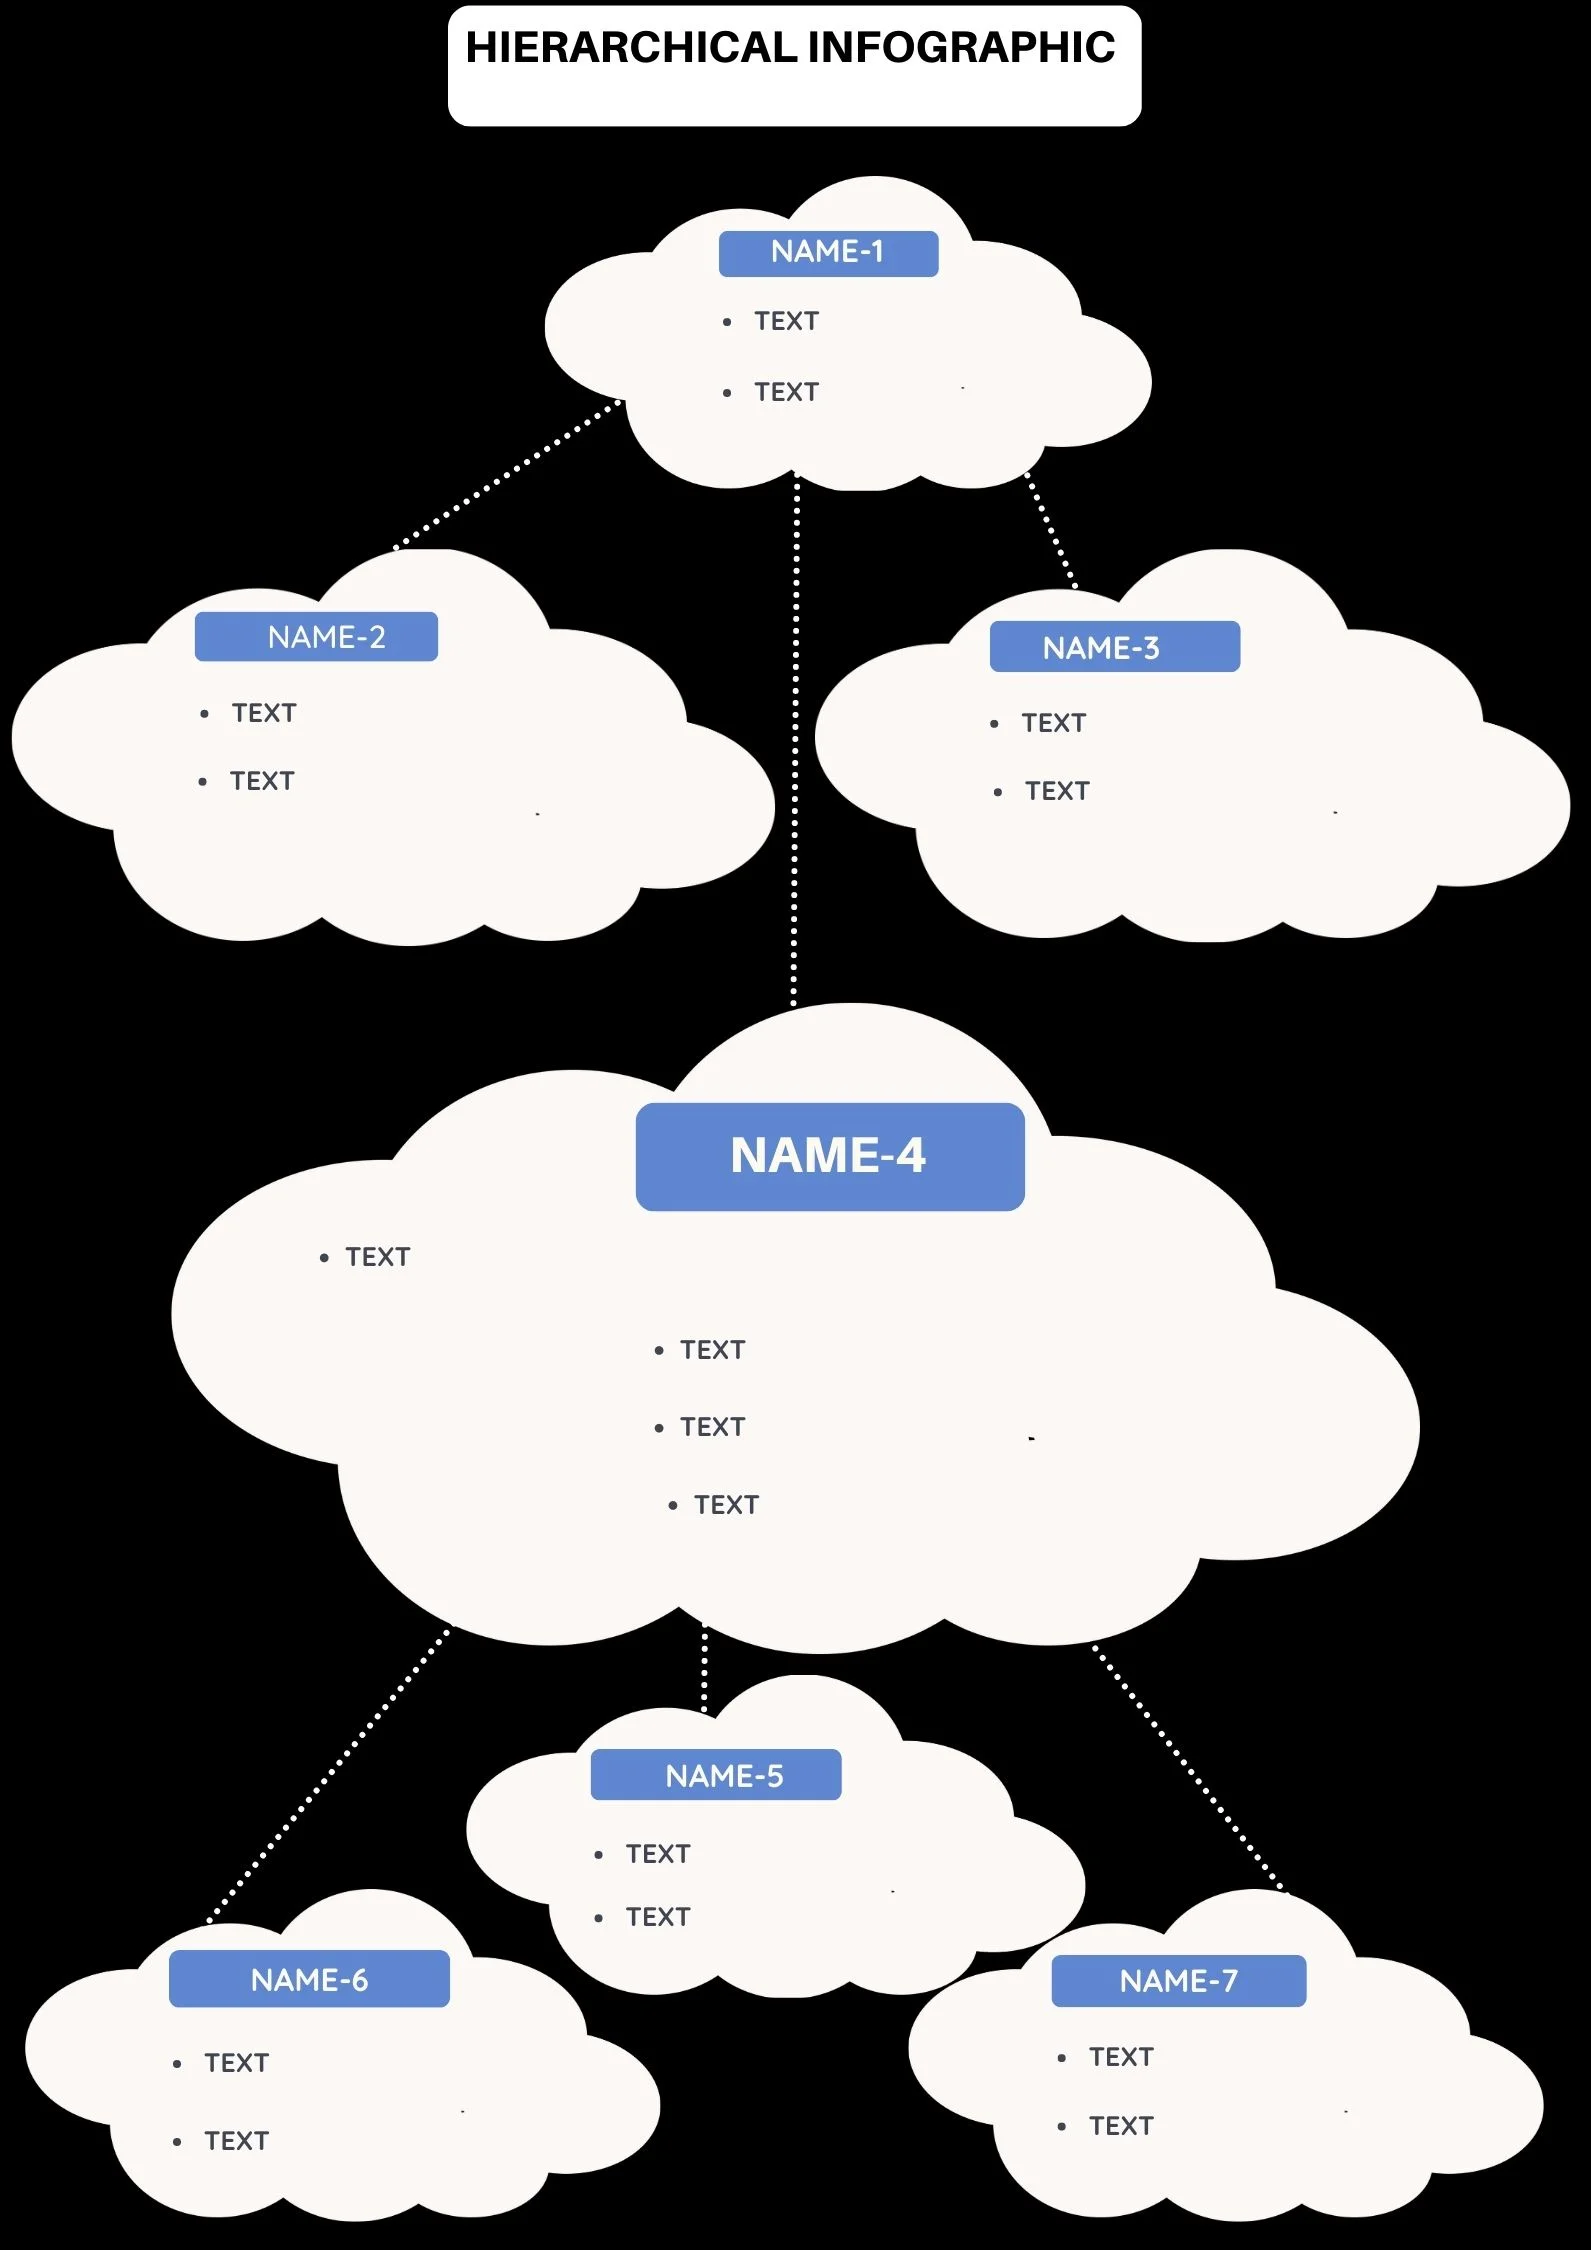
A Hierarchical Infographic template is a visual representation of a hierarchy of information. It typically features a main central graphic that represents the top-level information, with secondary graphics and information branching out from it.
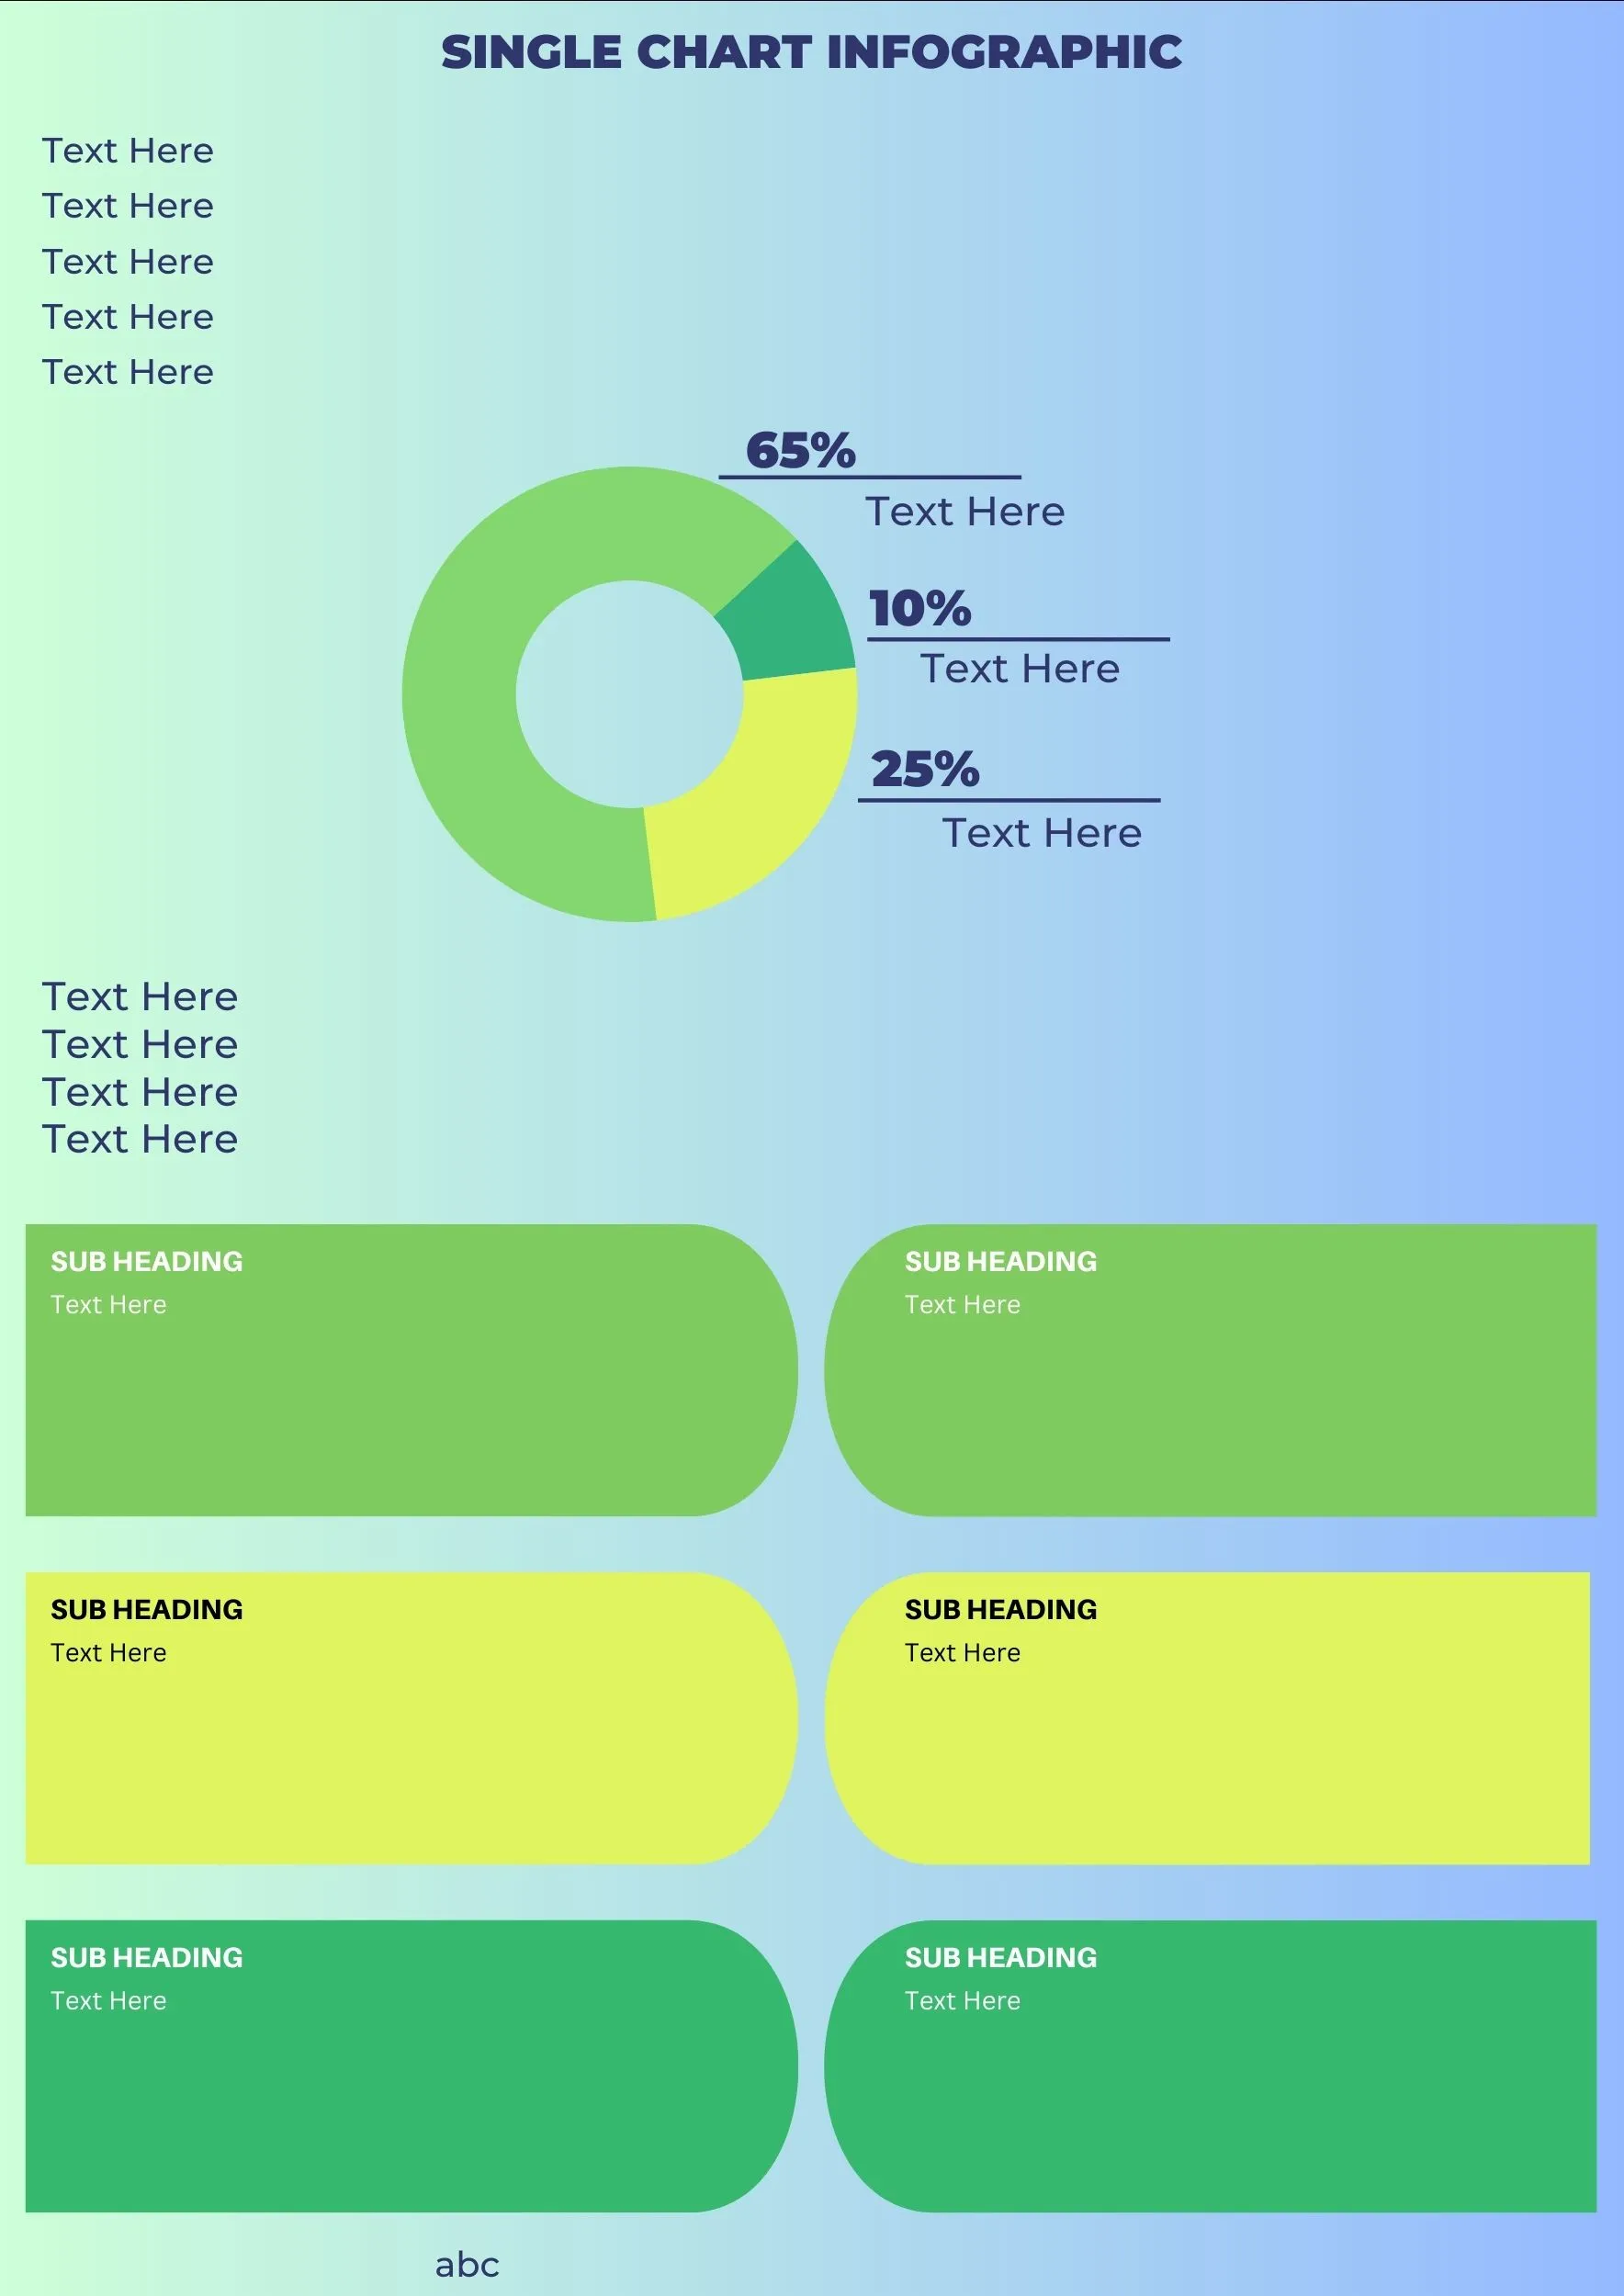
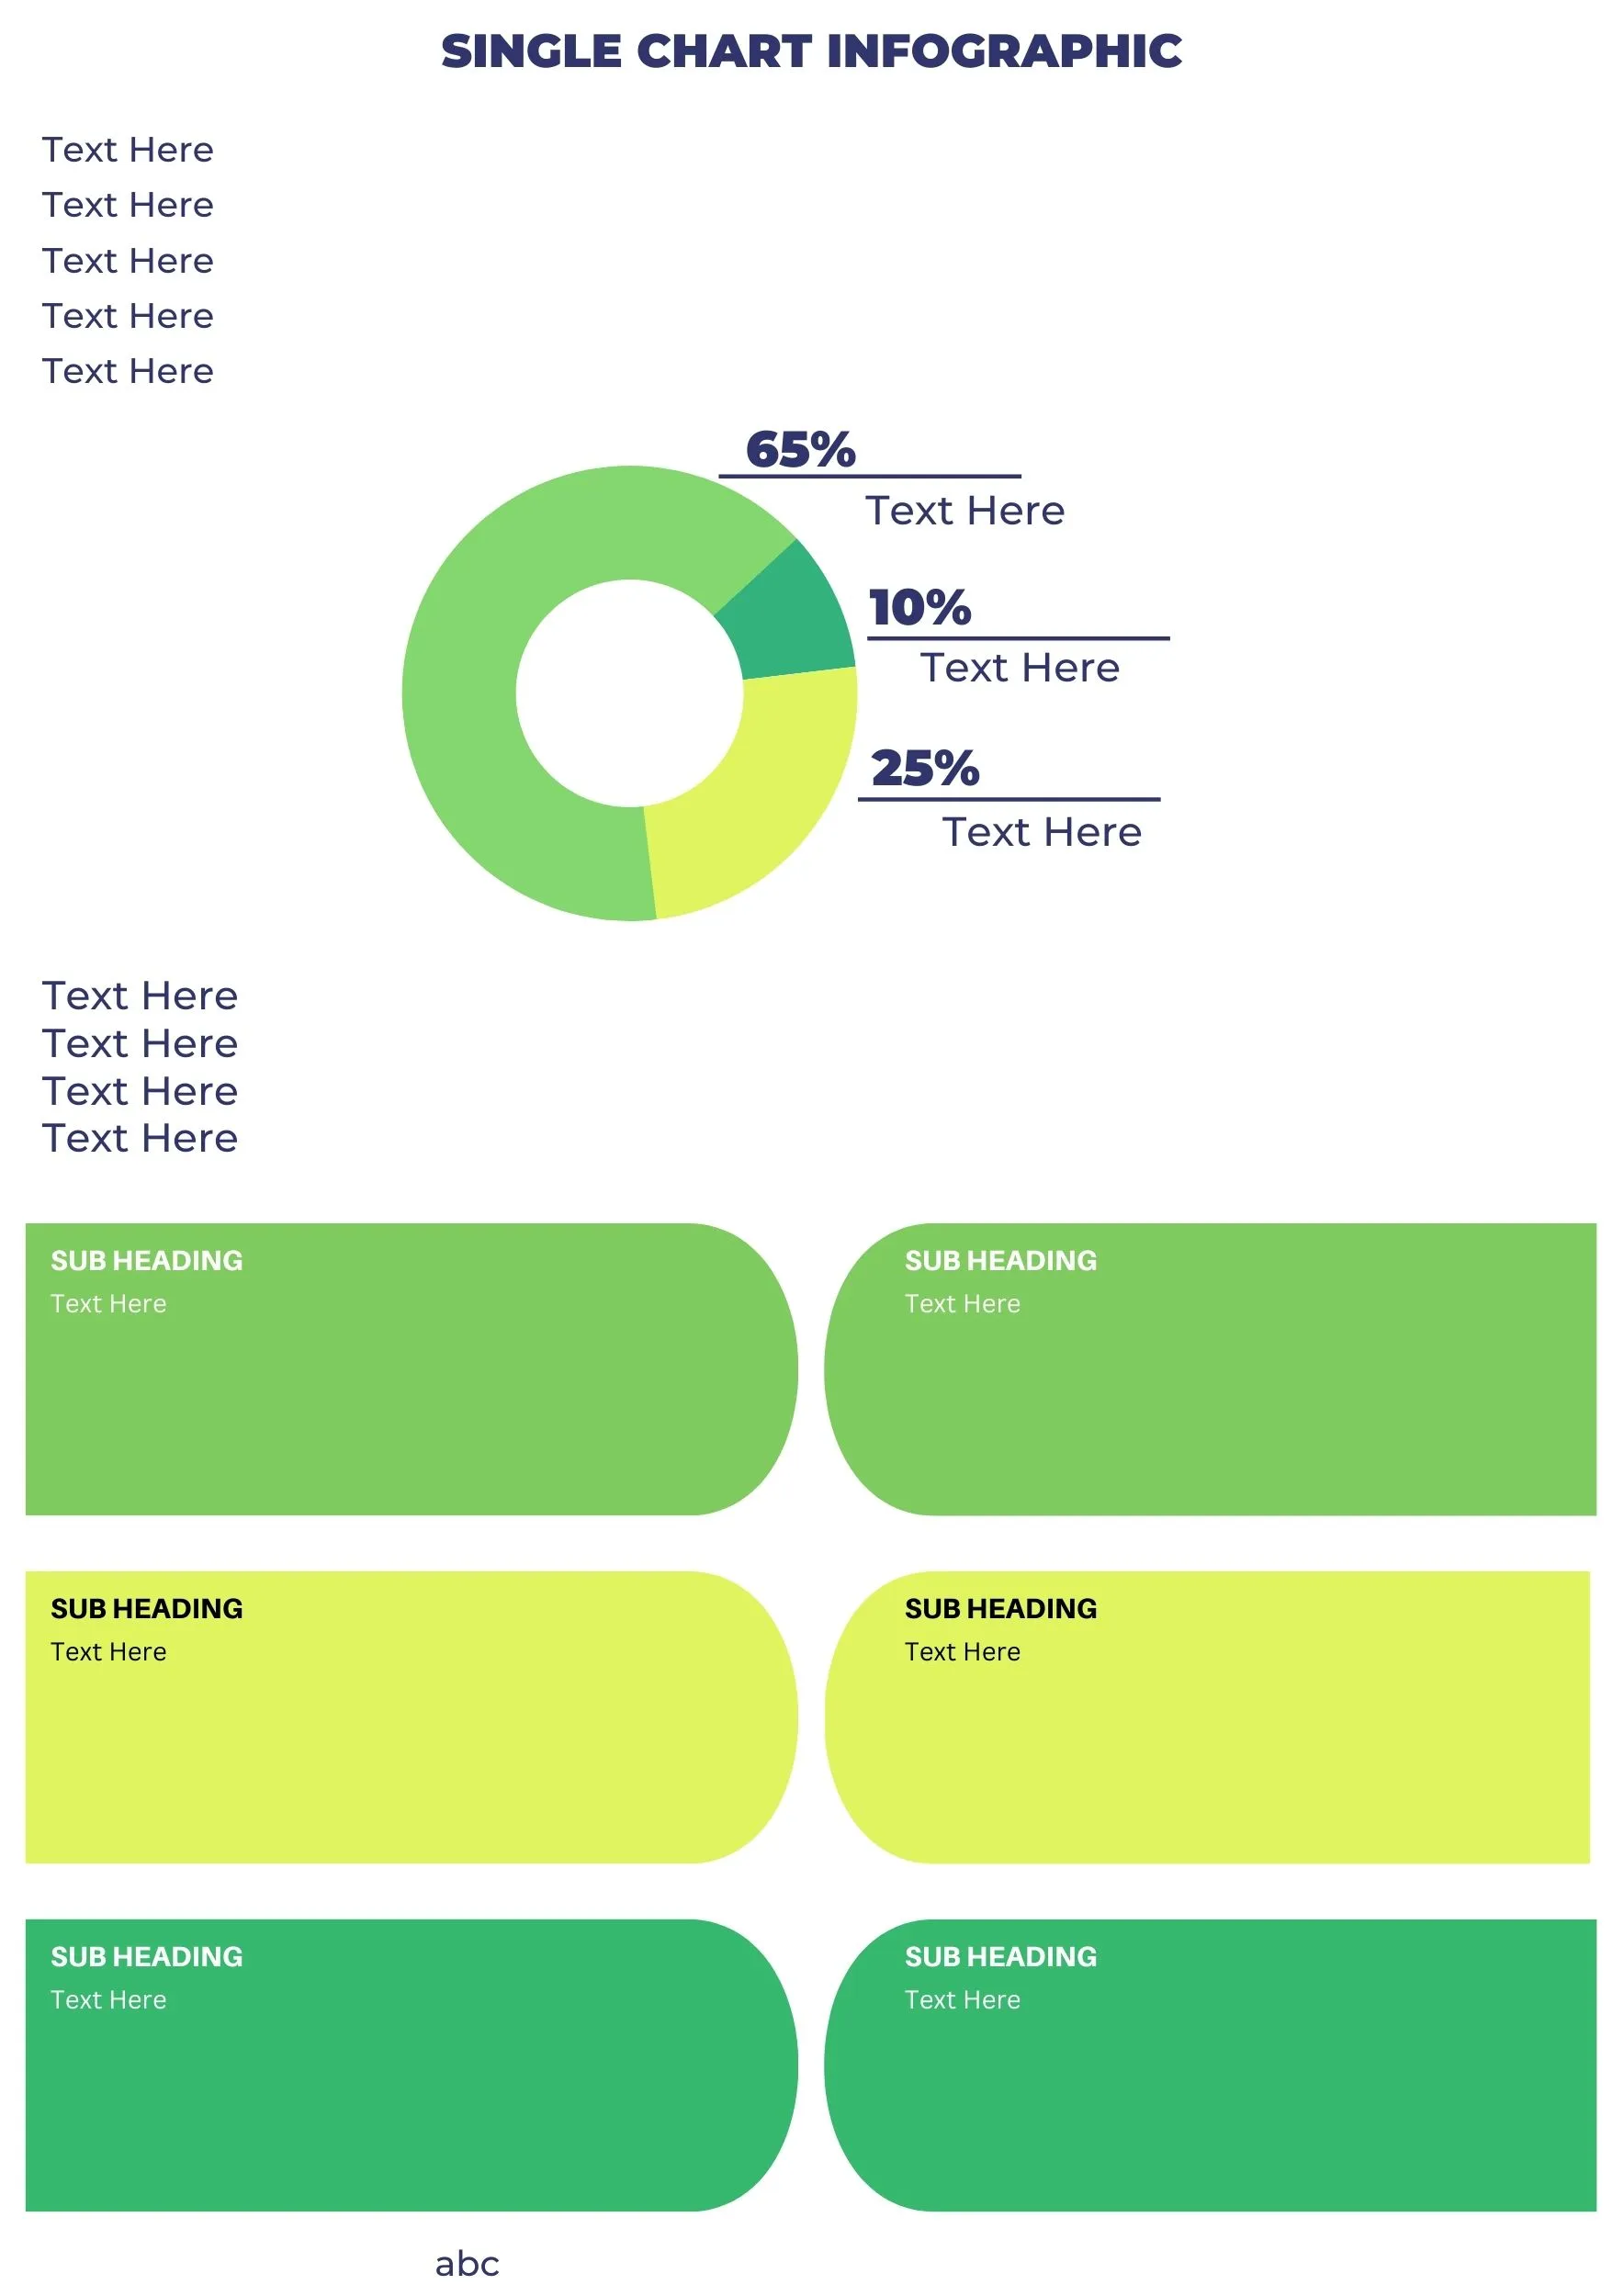
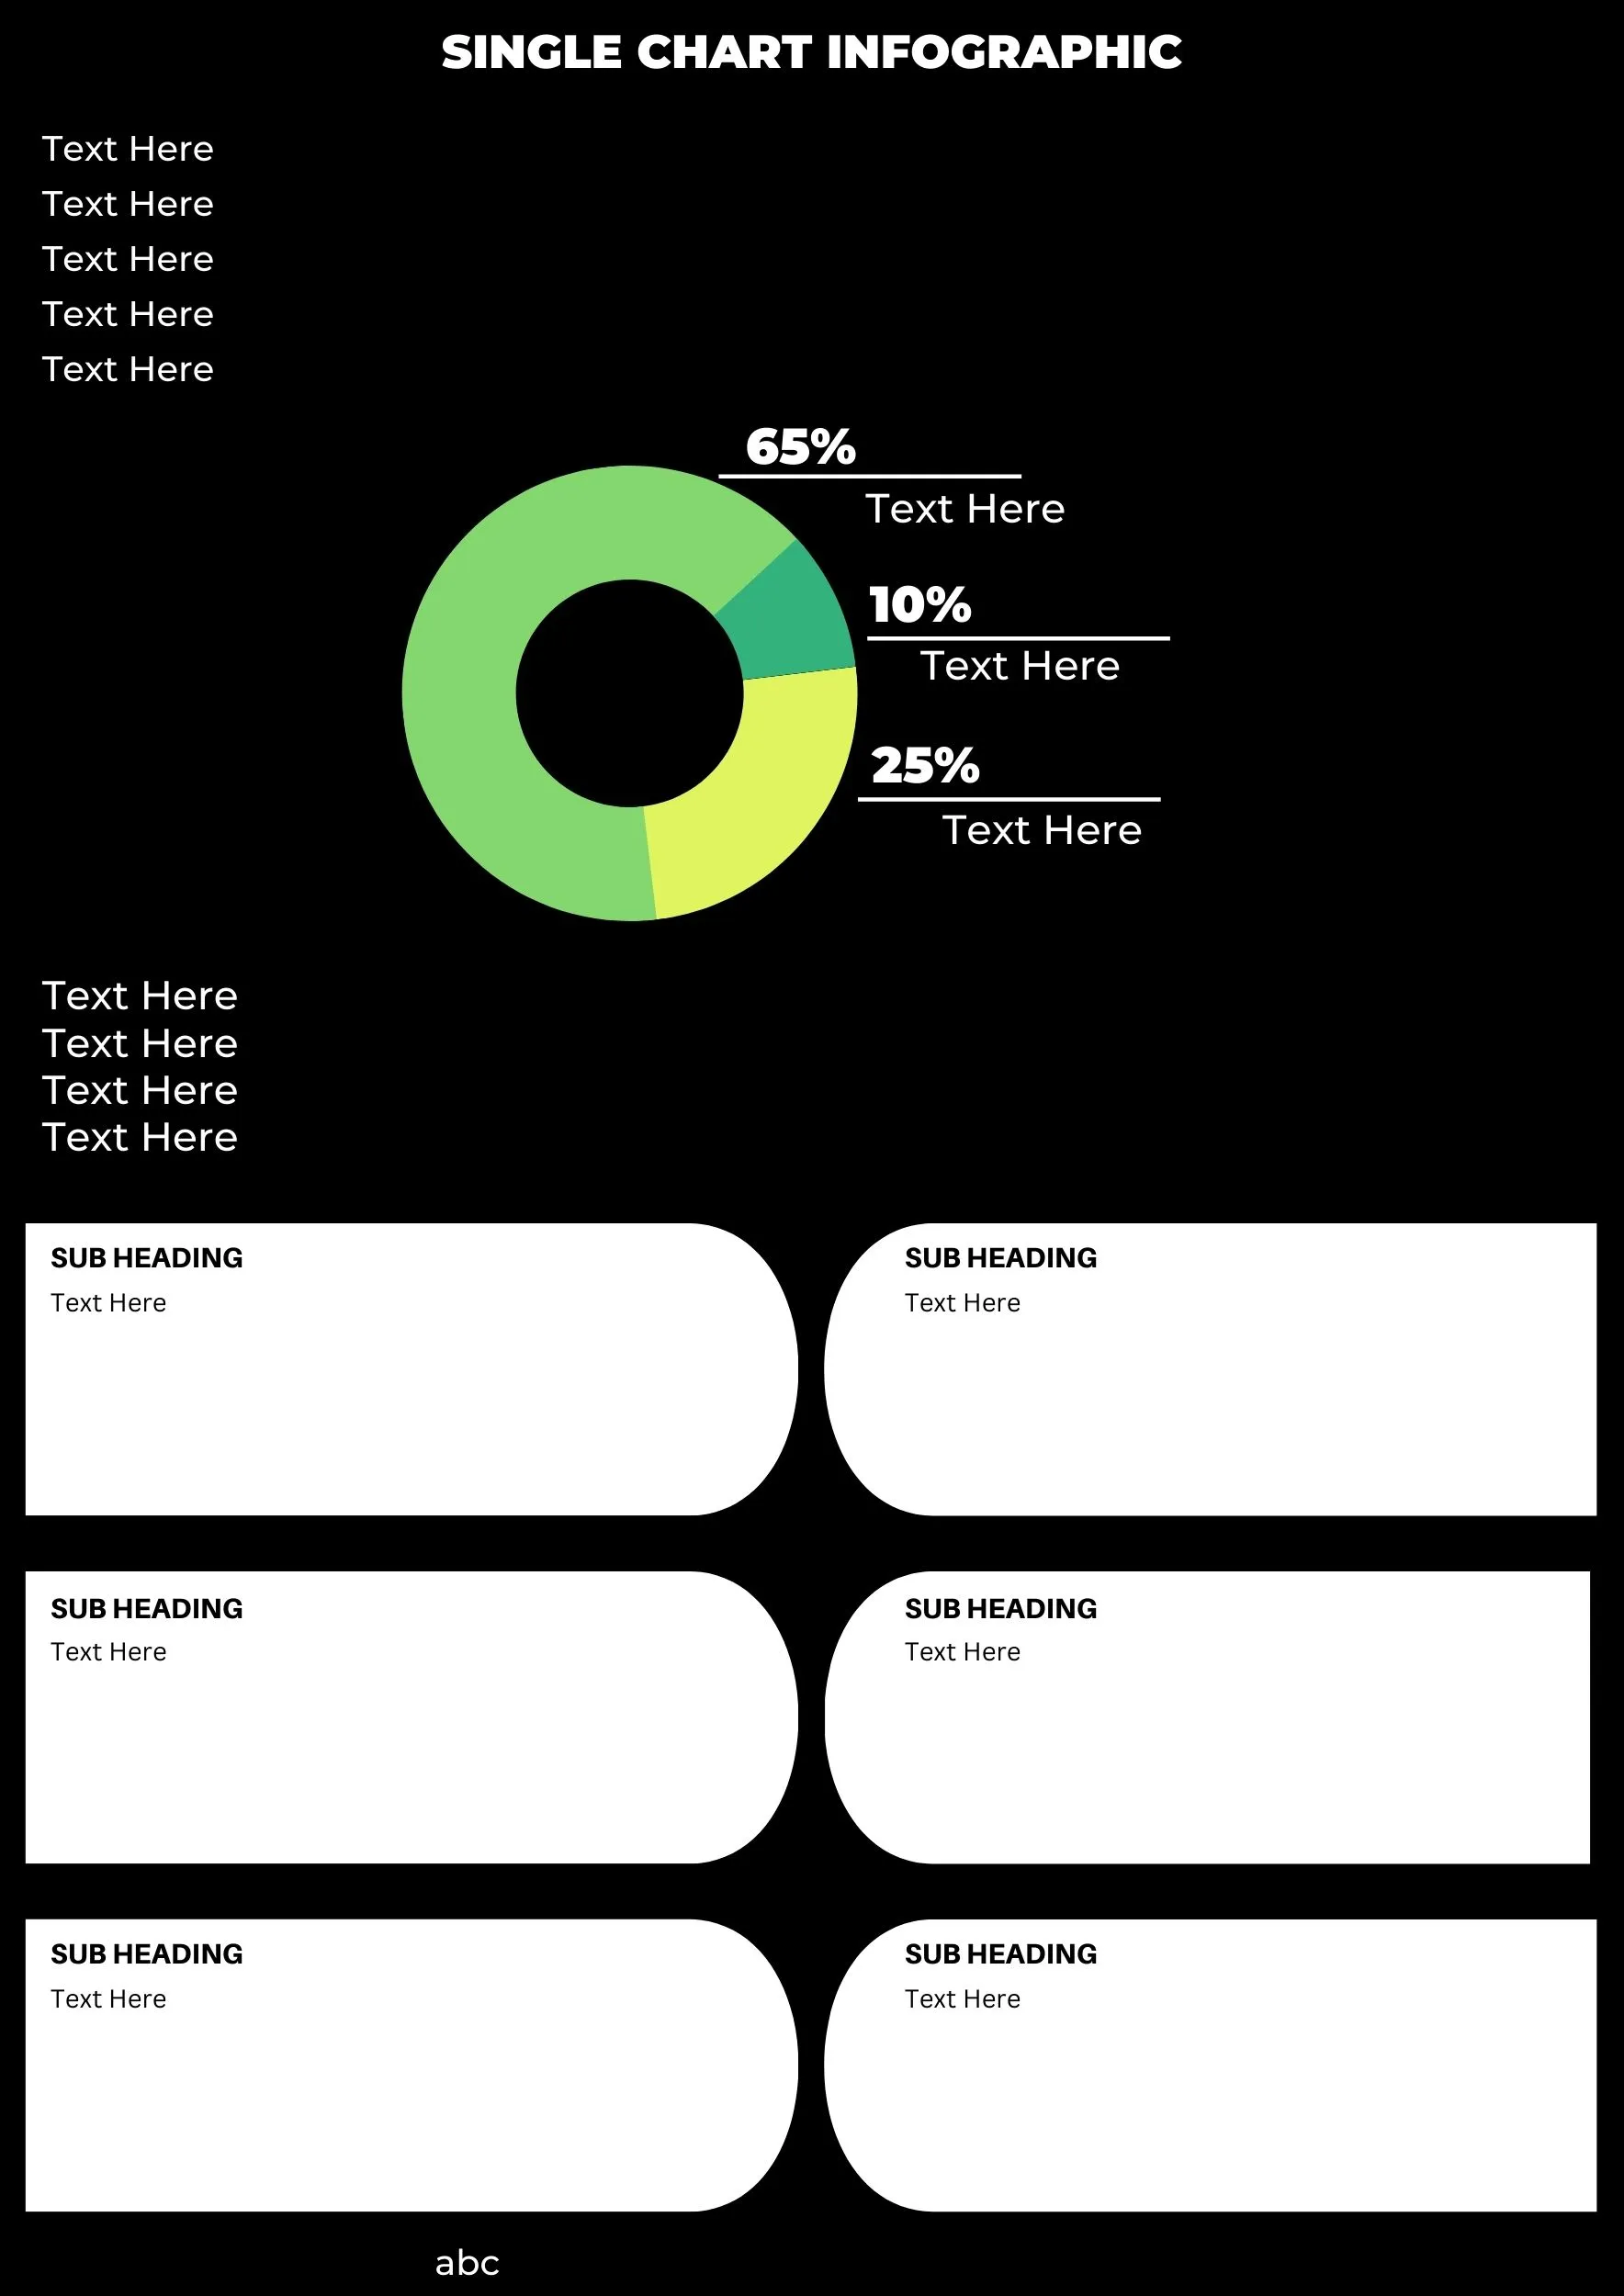
A single chart infographic template is a design that presents a single chart or graph in a visually appealing and easy-to-understand format. The chart can be anything from a line graph to a bar chart, and the data can relate to any topic, from sales figures to website traffic to social media engagement.
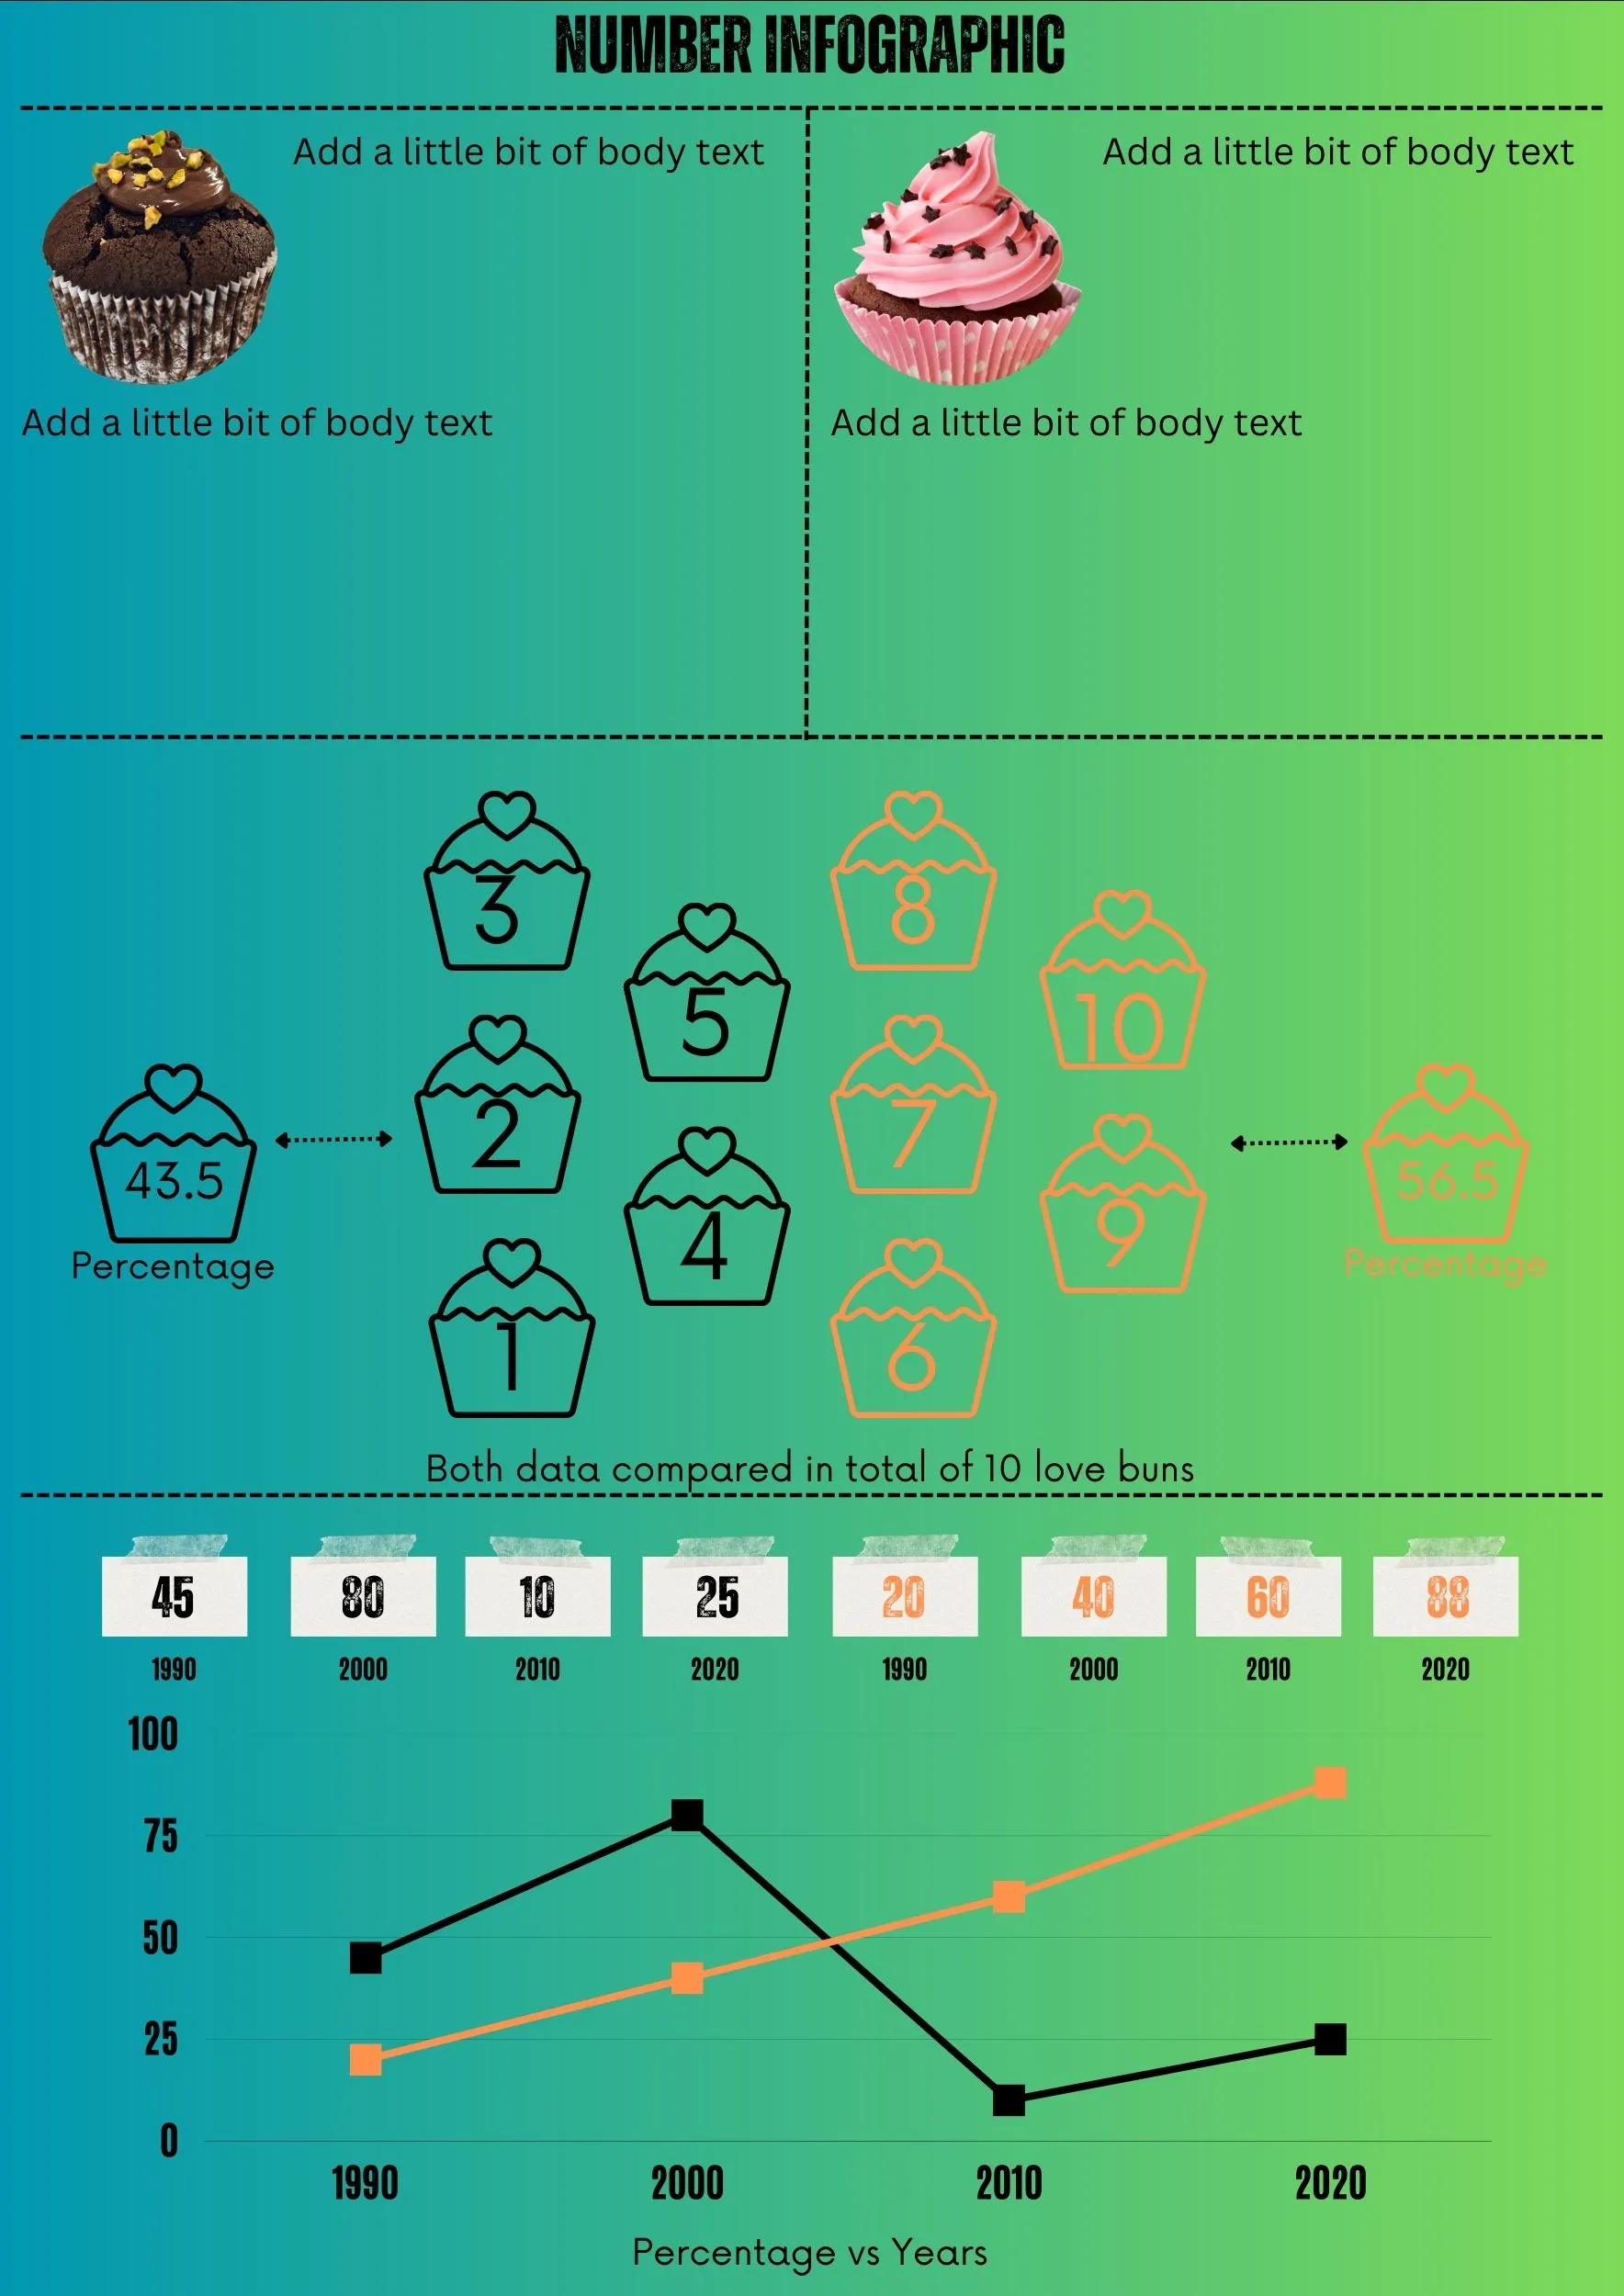
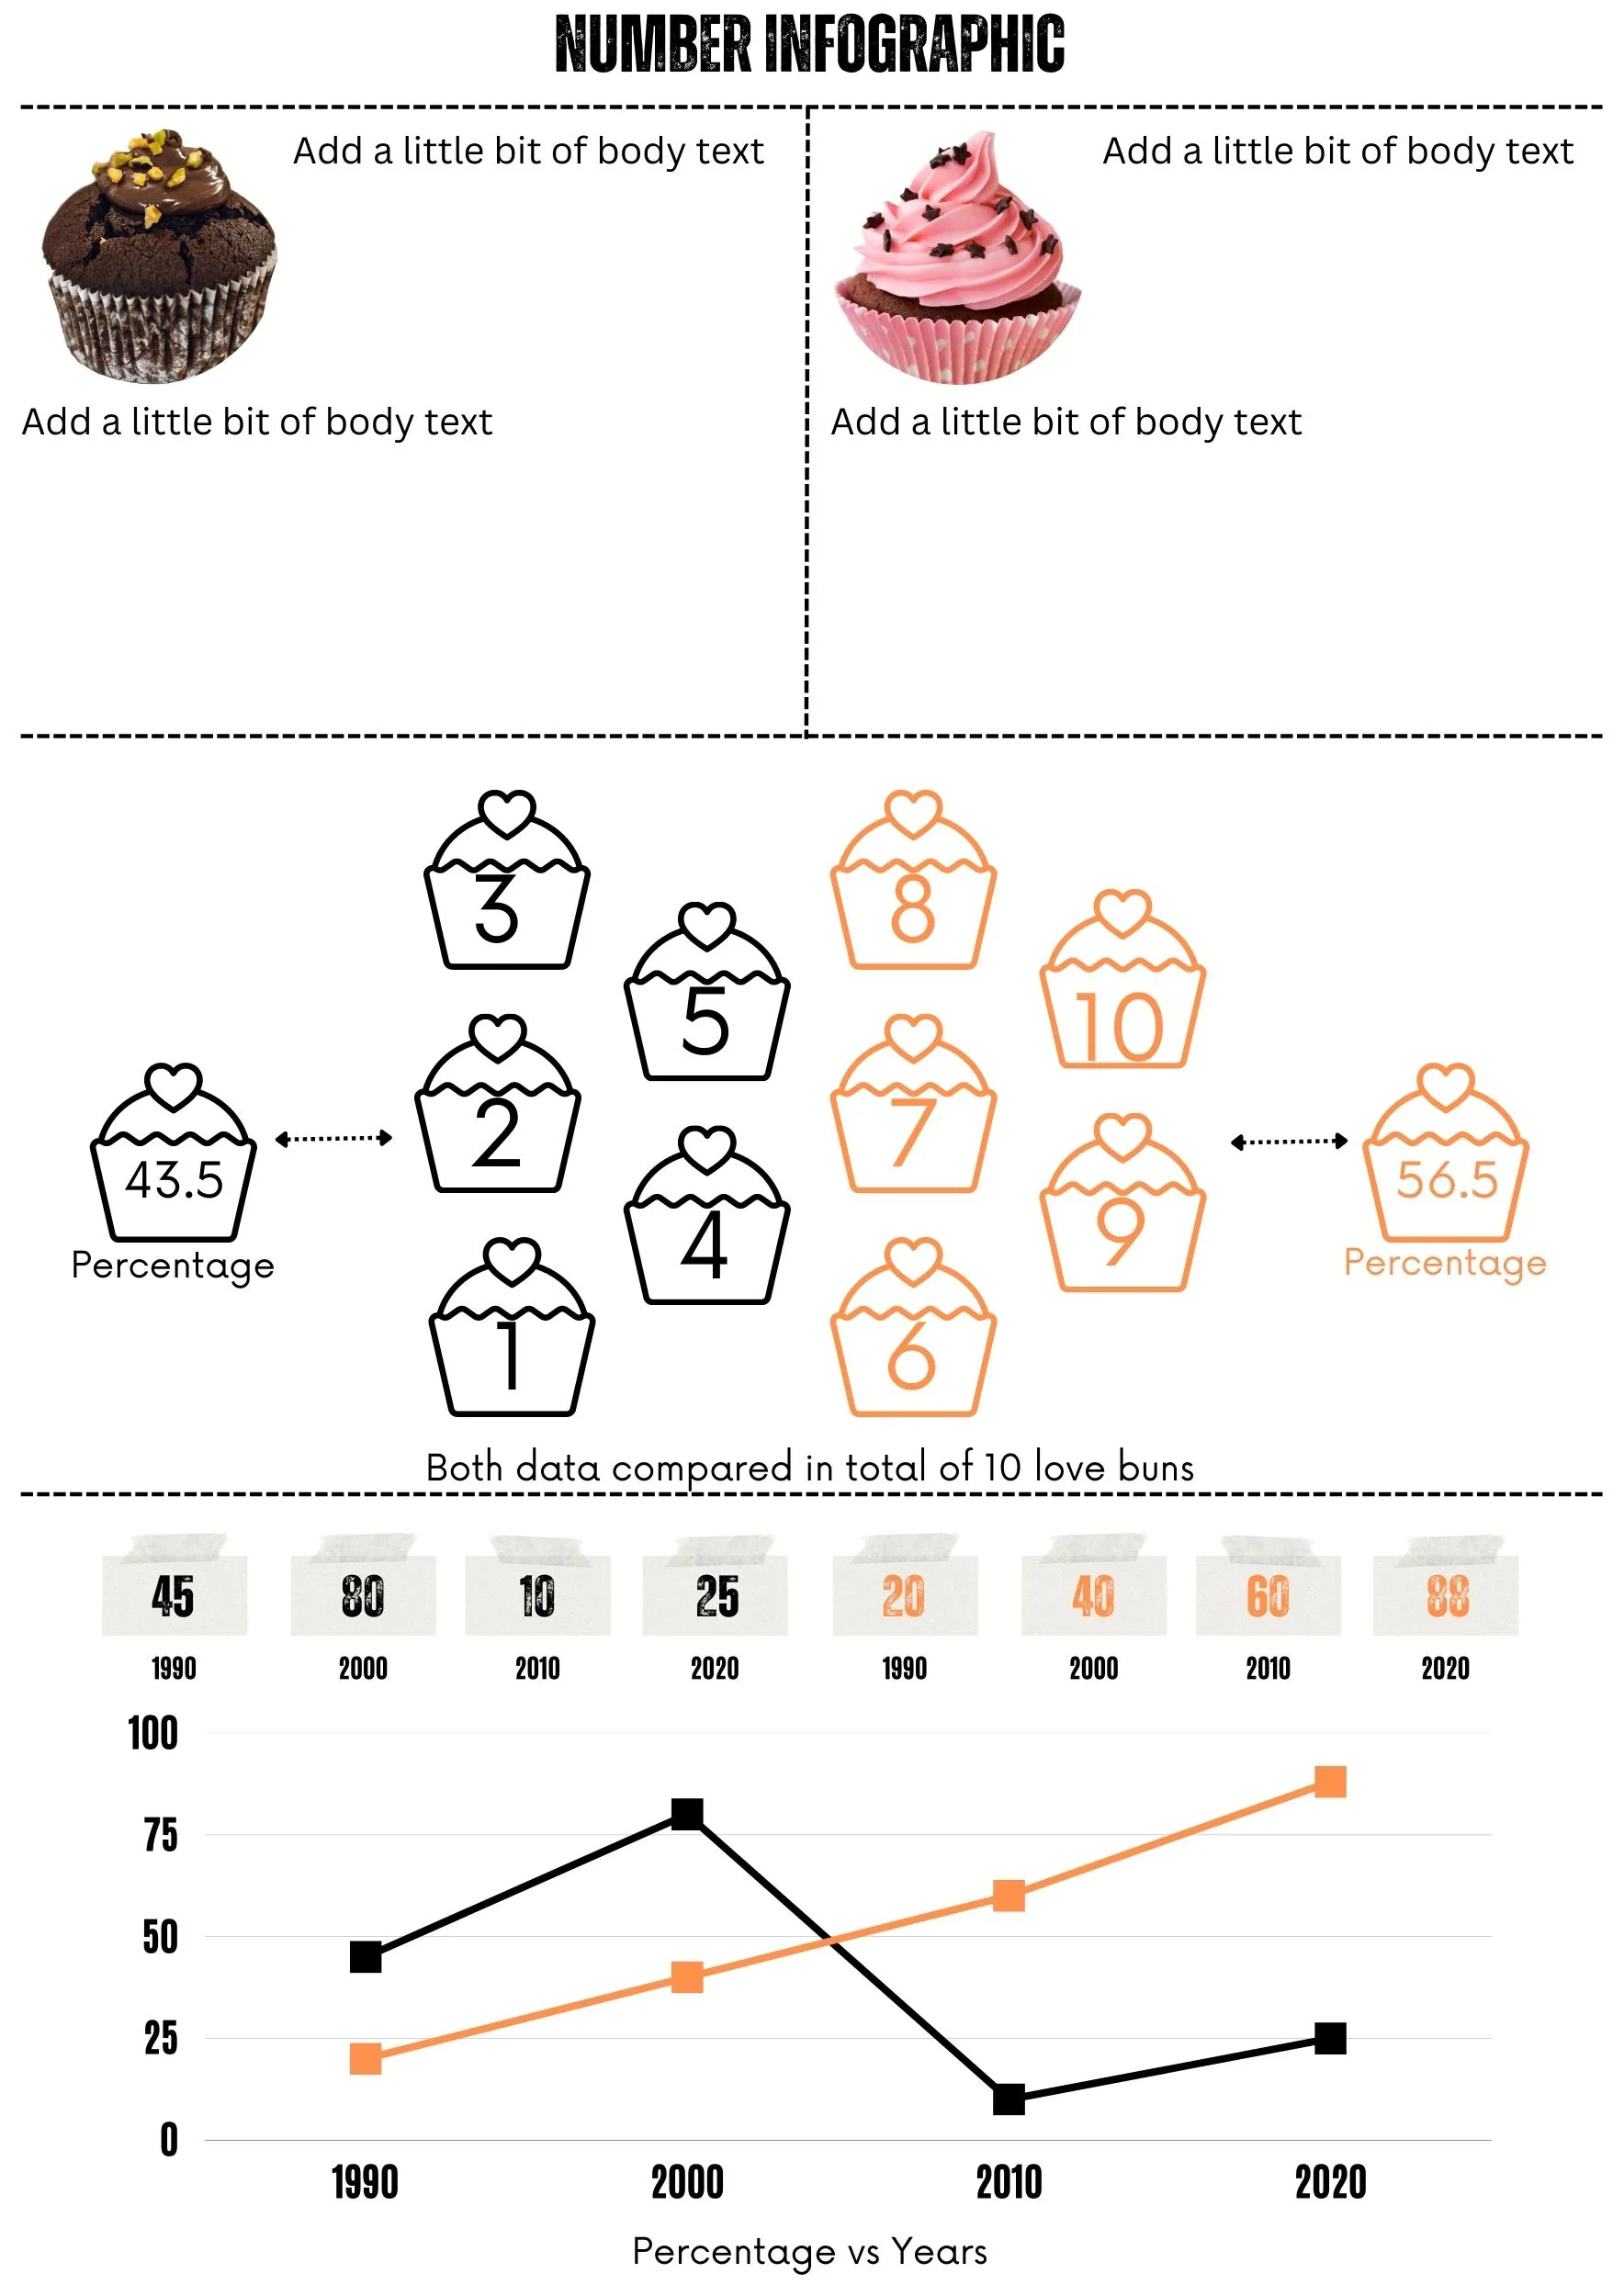
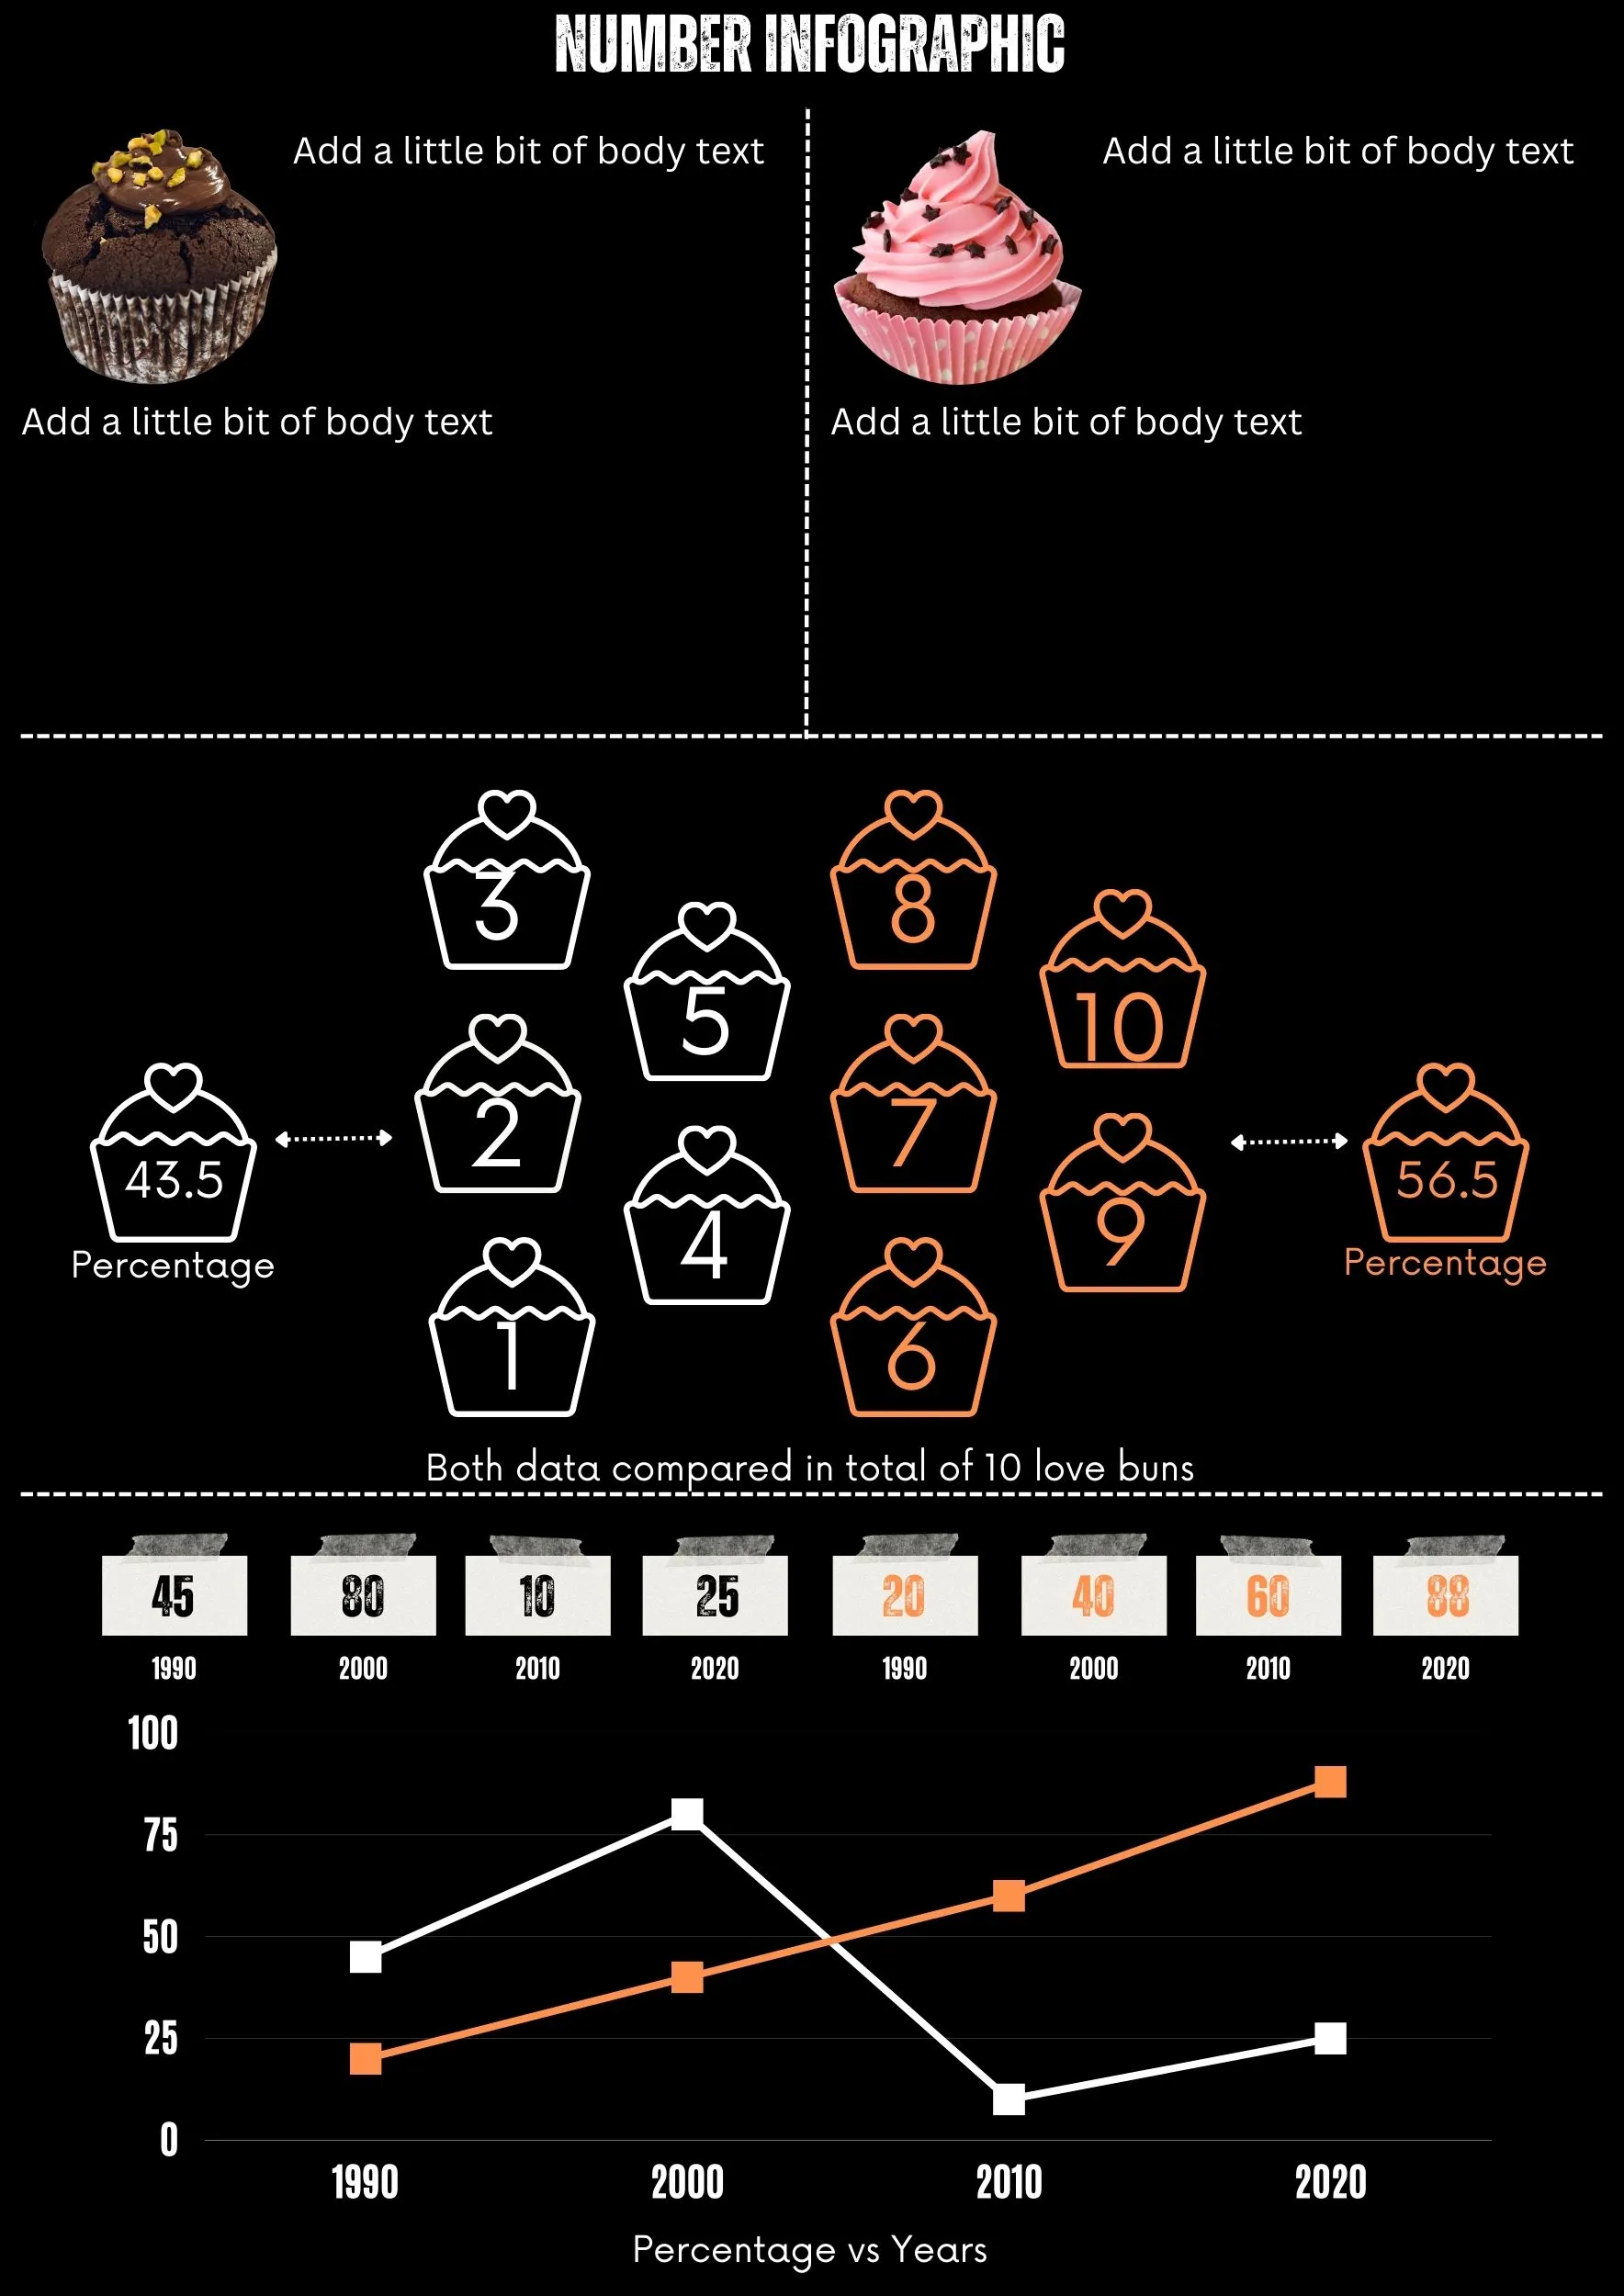
A visualized numbers infographic is a type of data visualization that uses images, icons, and other graphical elements to represent numerical data.
A visualized numbers infographic template is an essential tool for anyone looking to present data in a way that is engaging, memorable, and easily understood. By using images and icons to represent numerical data, it can help to simplify complex information and make it more accessible to readers. Whether you are presenting data in a business context or for personal use, a visualized numbers infographic can be an effective way to communicate your message.
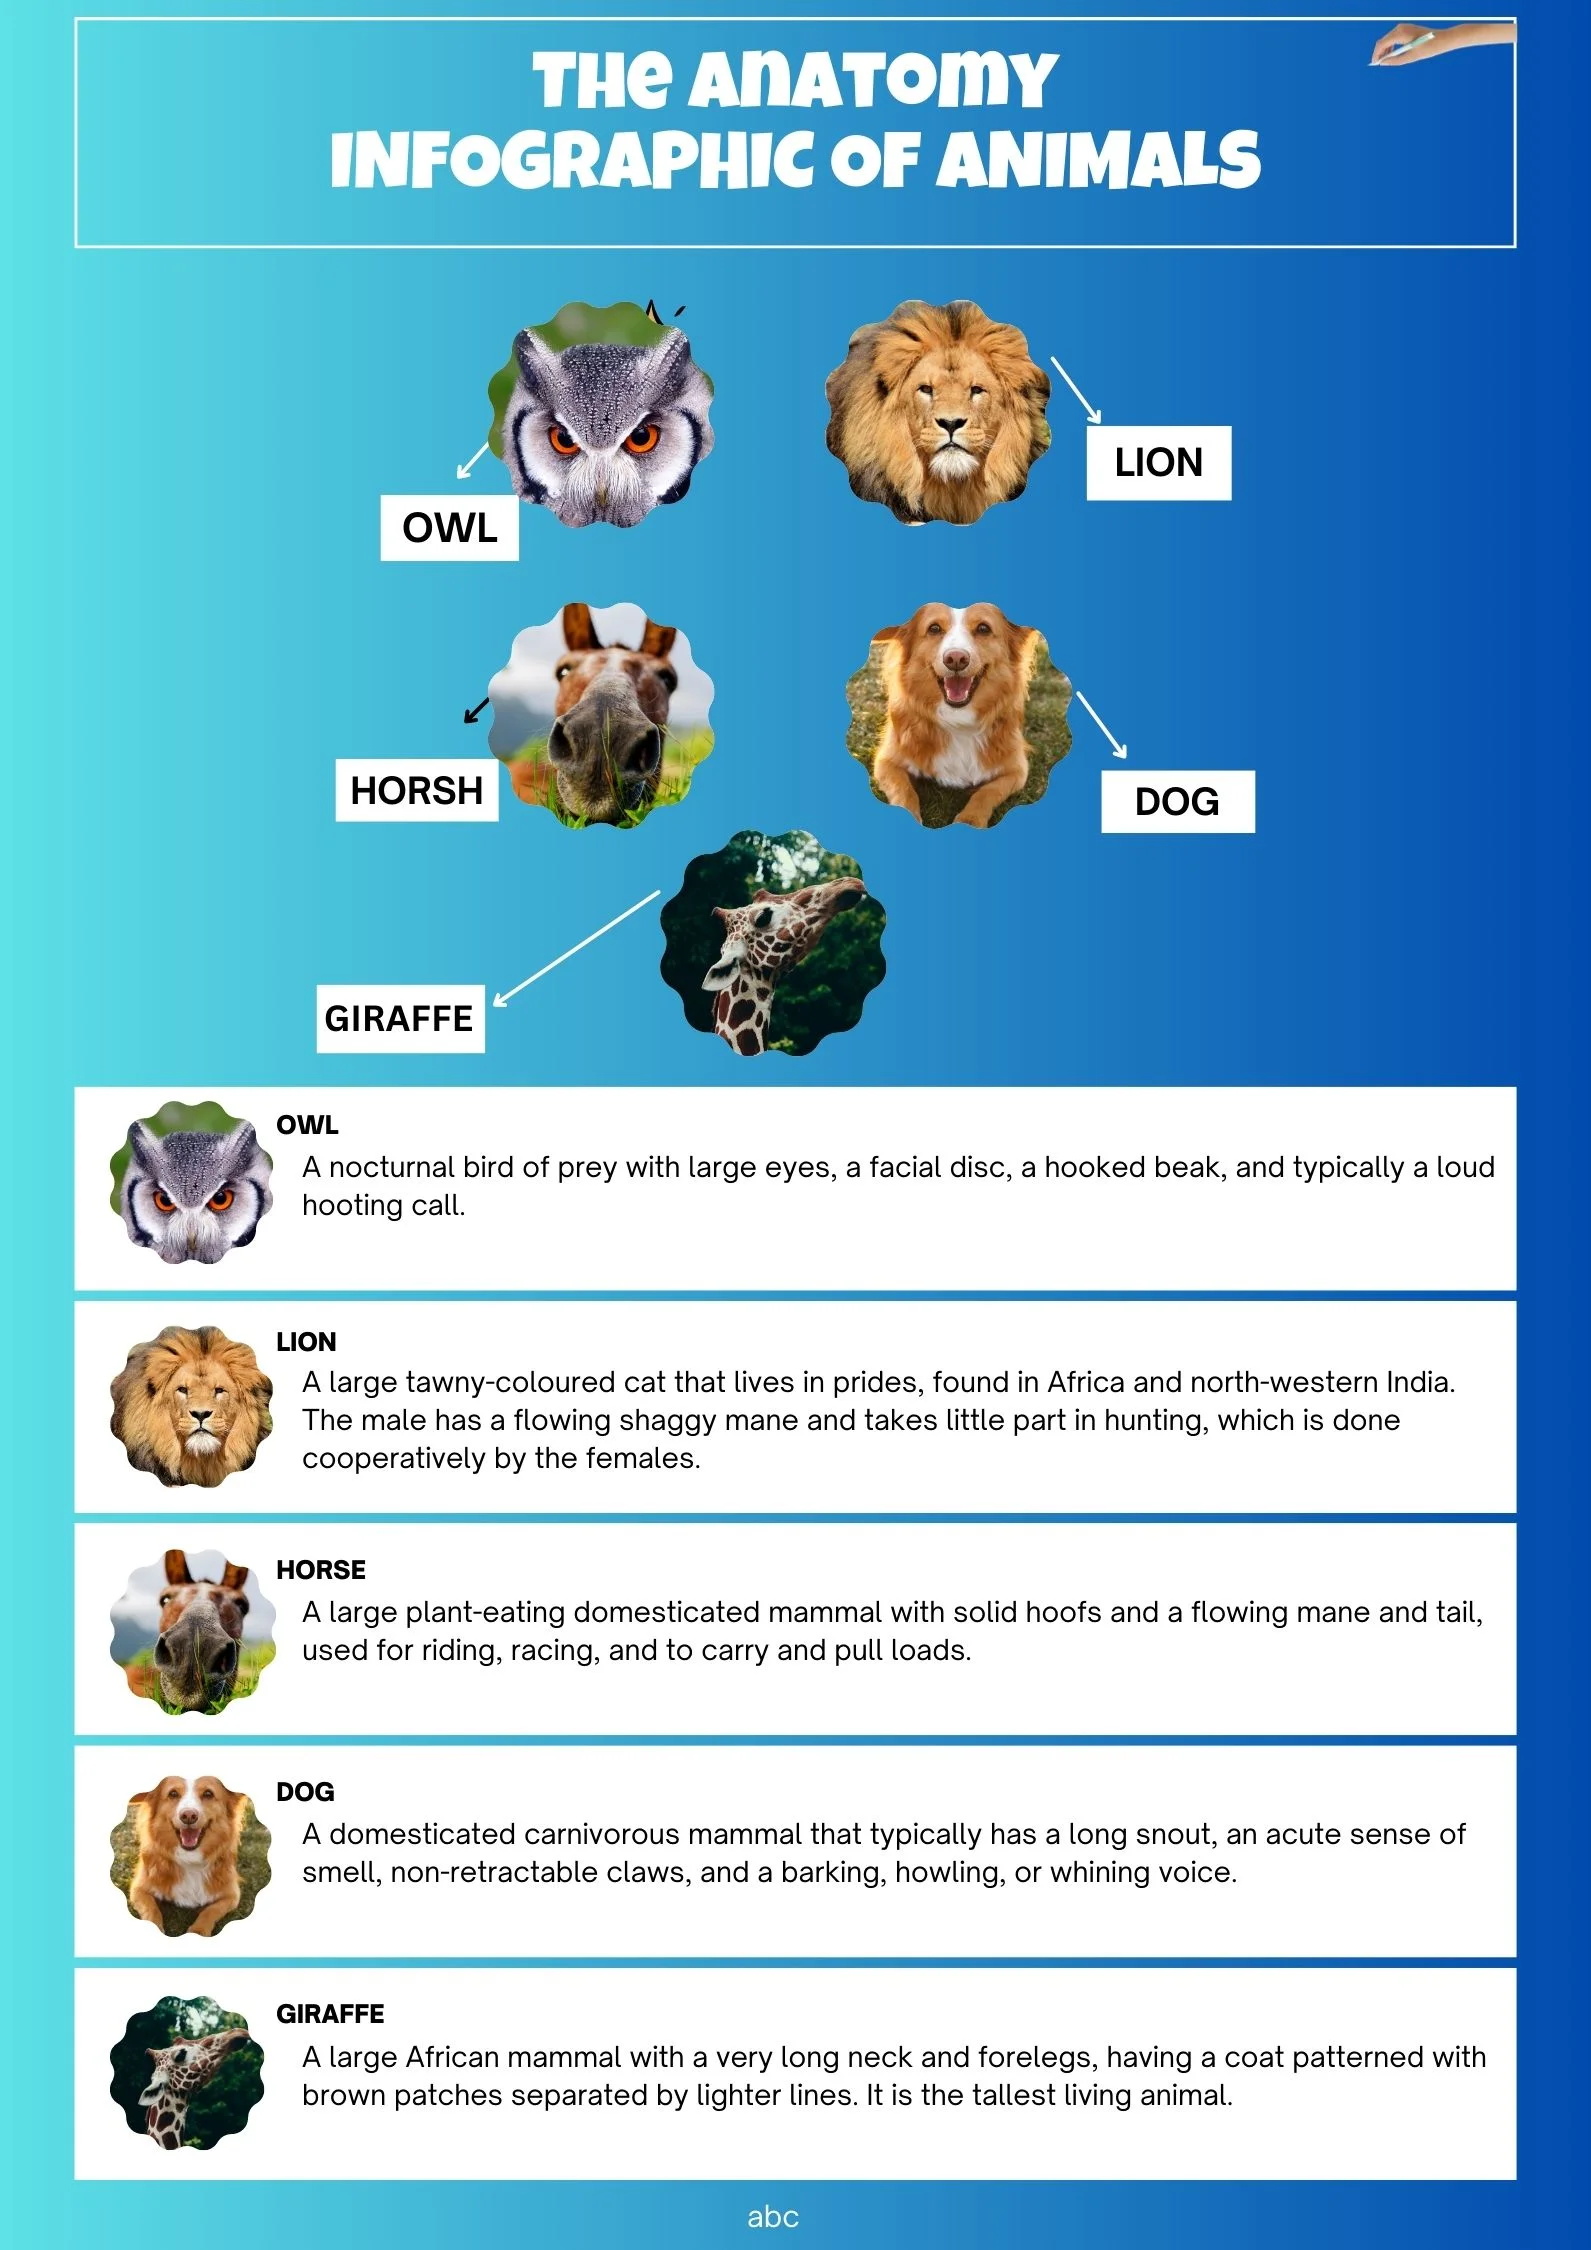
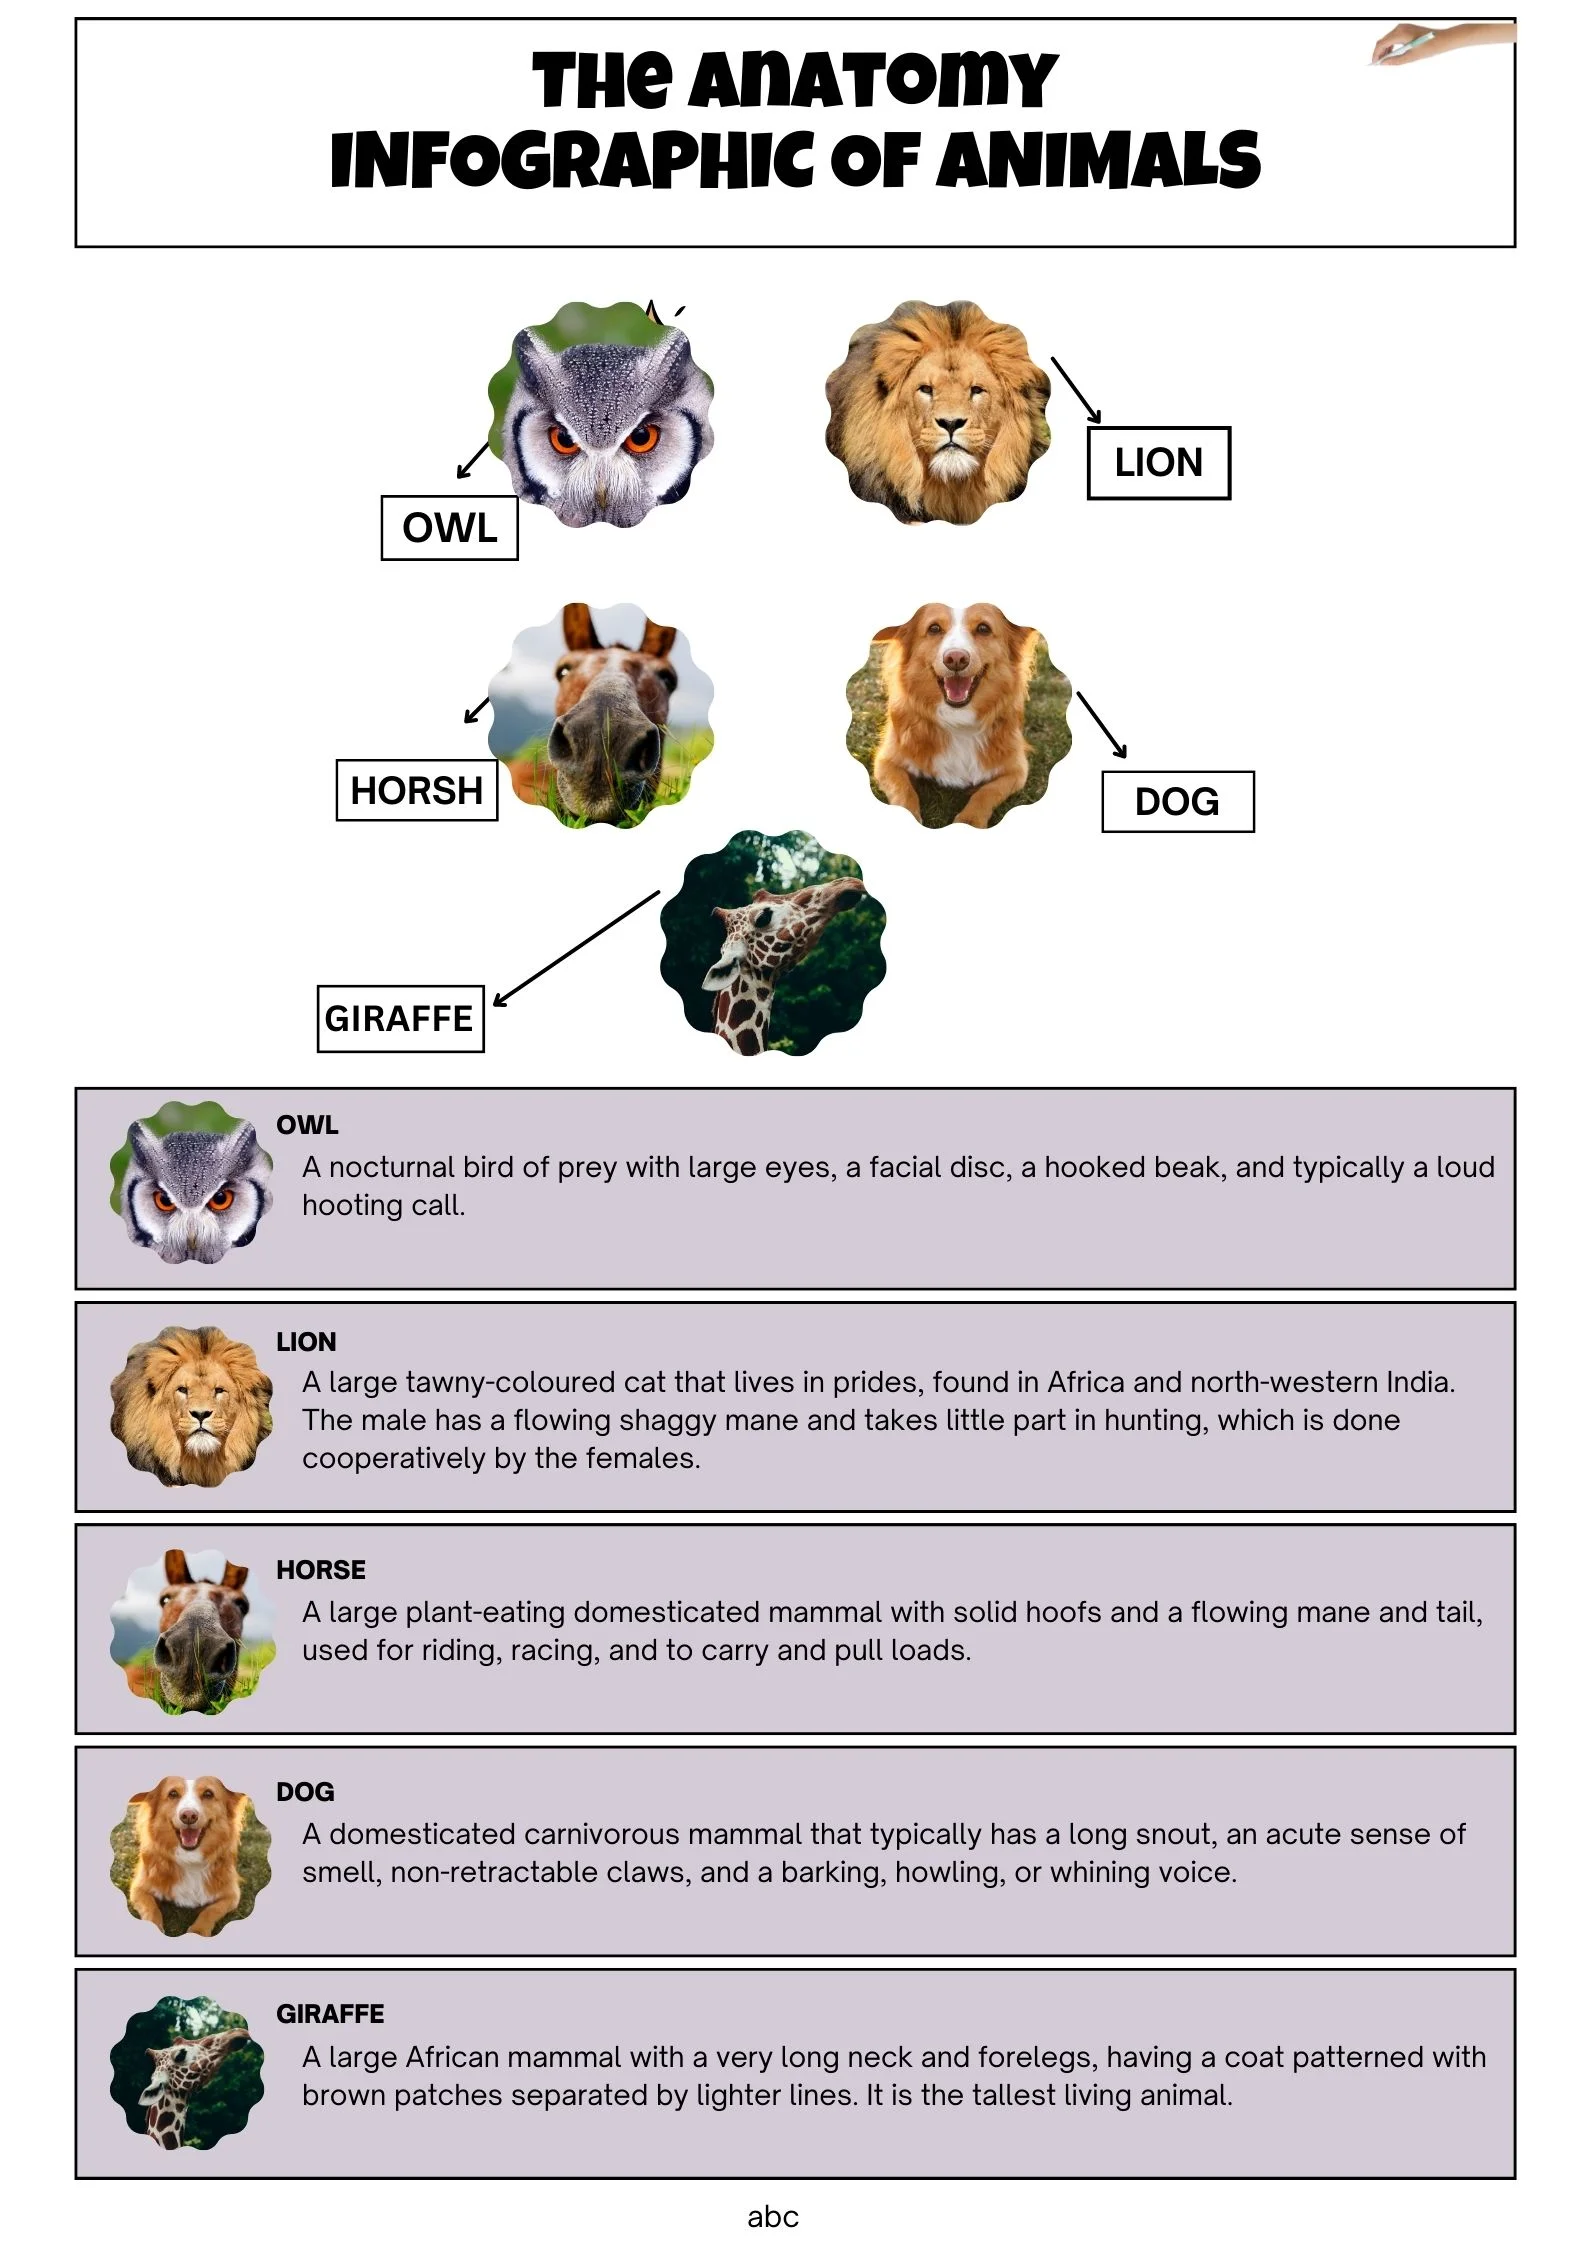
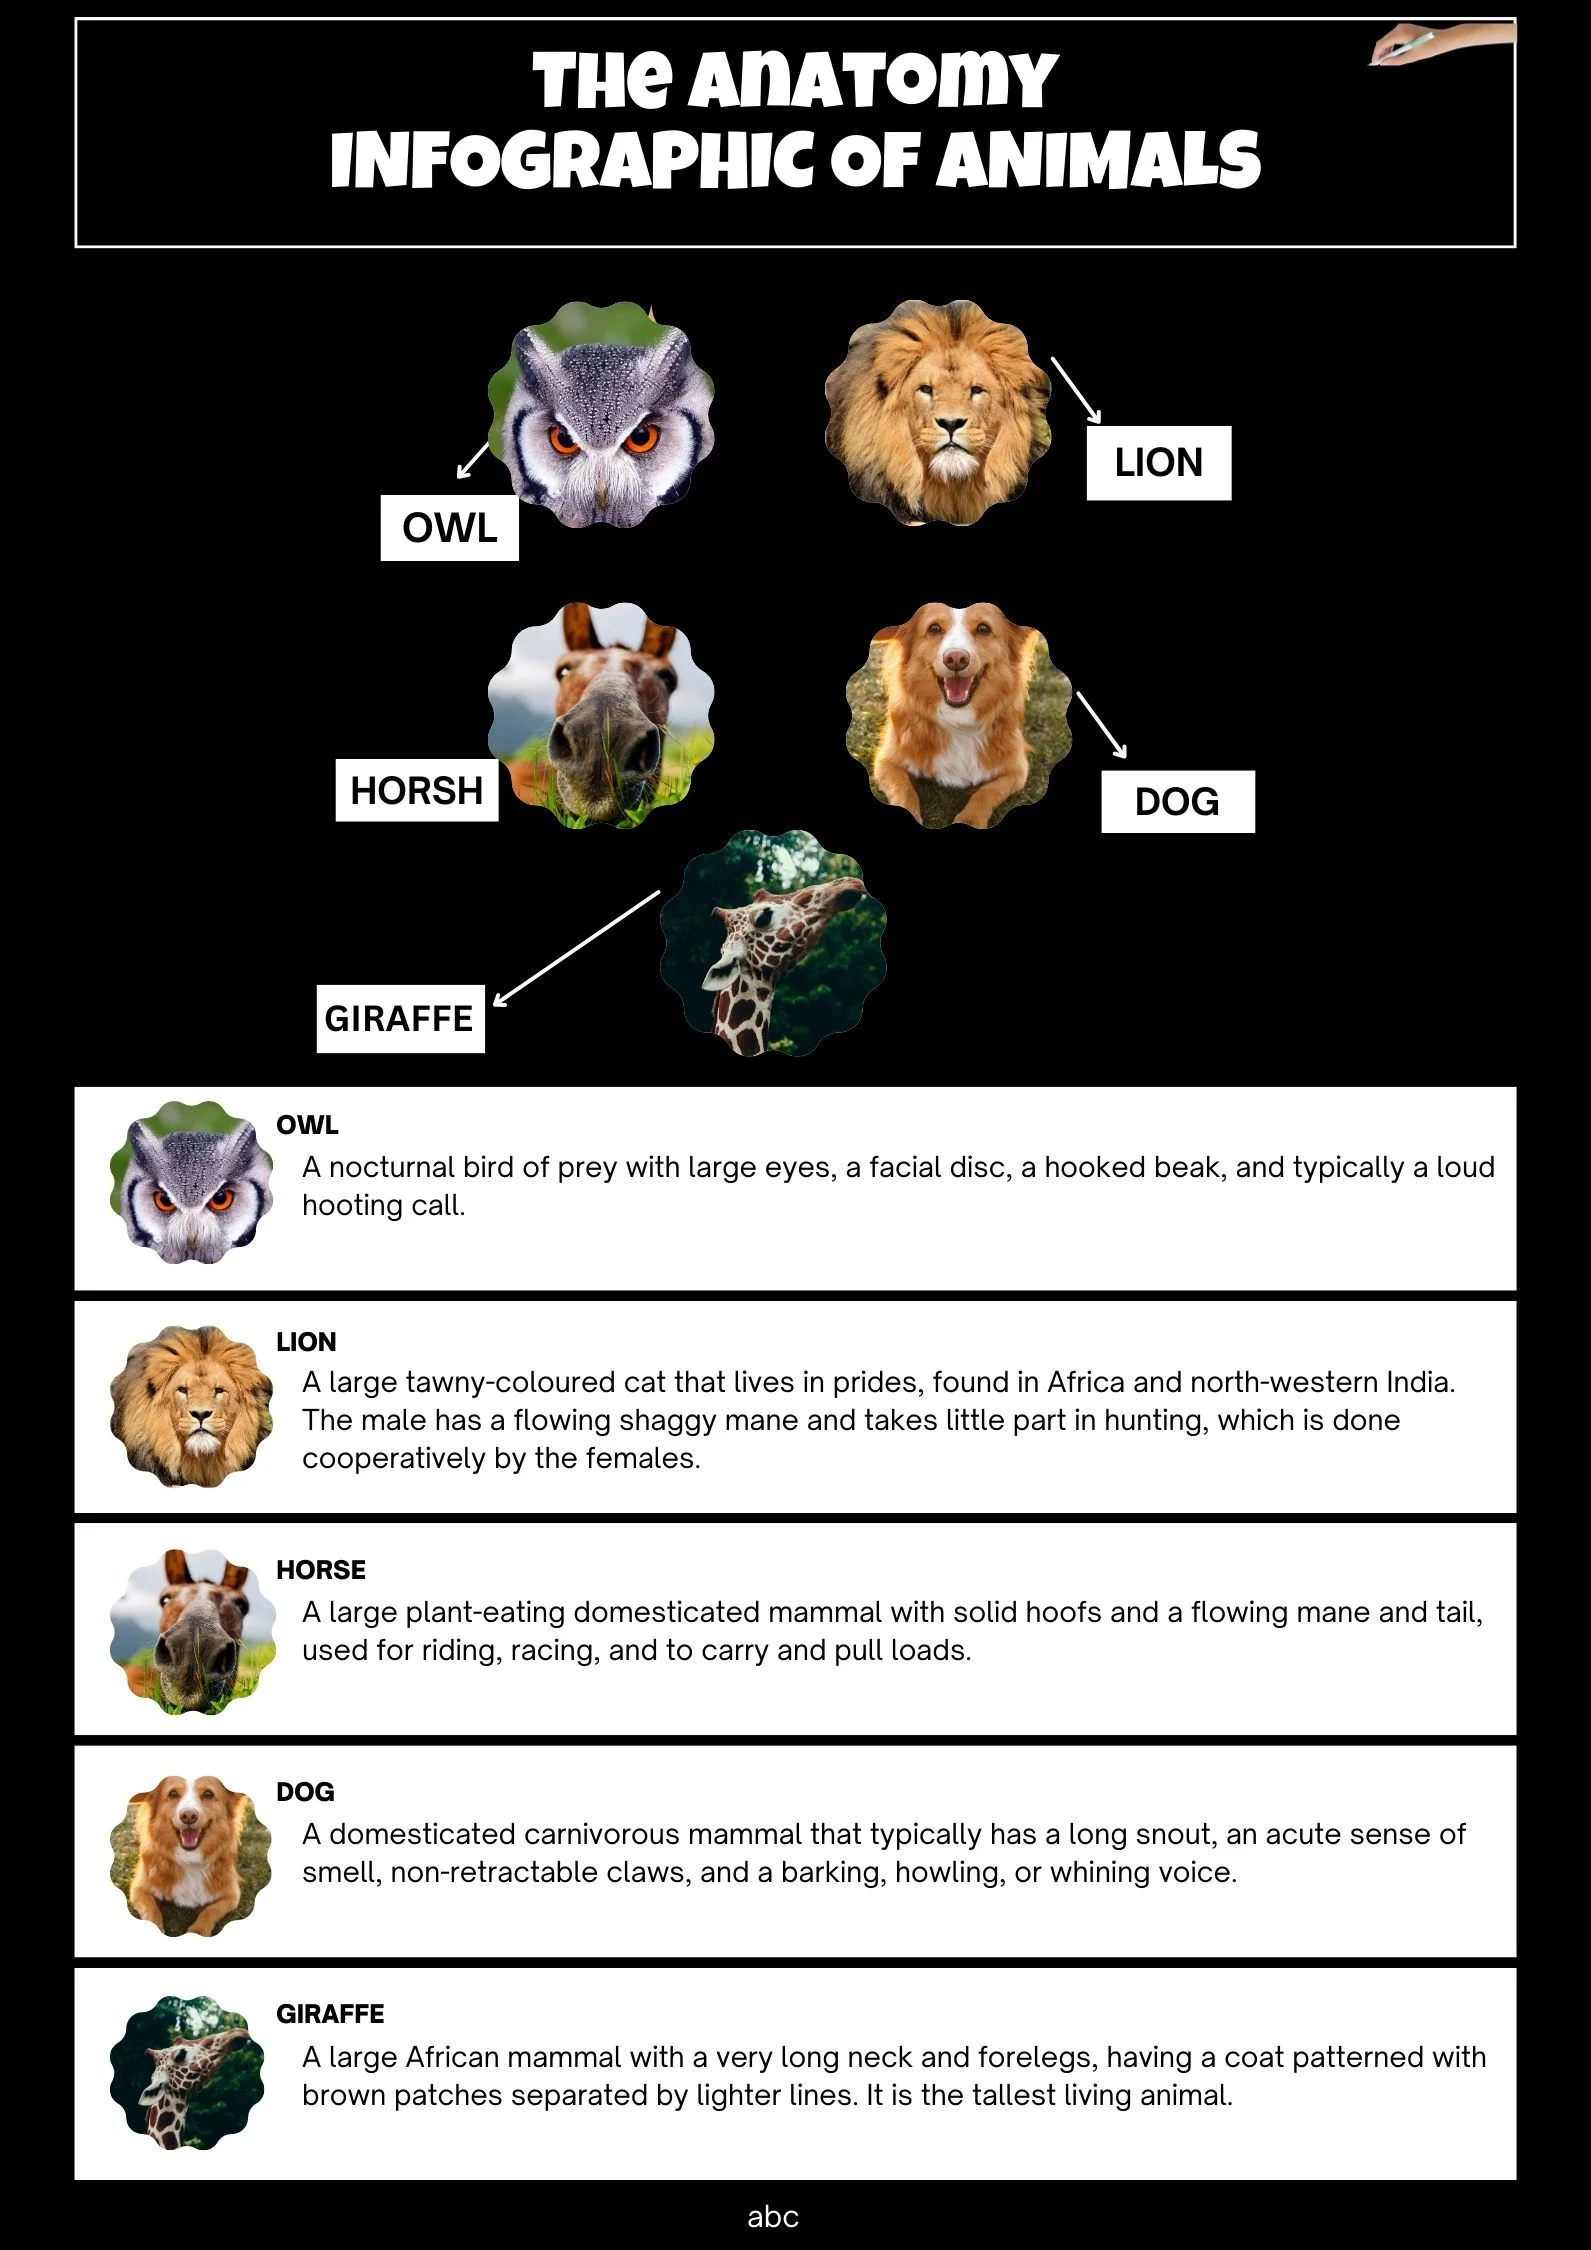
As a visual learner, I find that infographics are a great way to convey information in a clear and easy-to-understand way. An anatomical infographic template can be particularly useful for students or healthcare professionals looking to create a visual aid for a presentation or study material.
An anatomical infographic template typically includes labeled illustrations of various body parts and systems. This can range from a simple diagram of the heart and its chambers, to a more detailed breakdown of the skeletal system and its different bones.
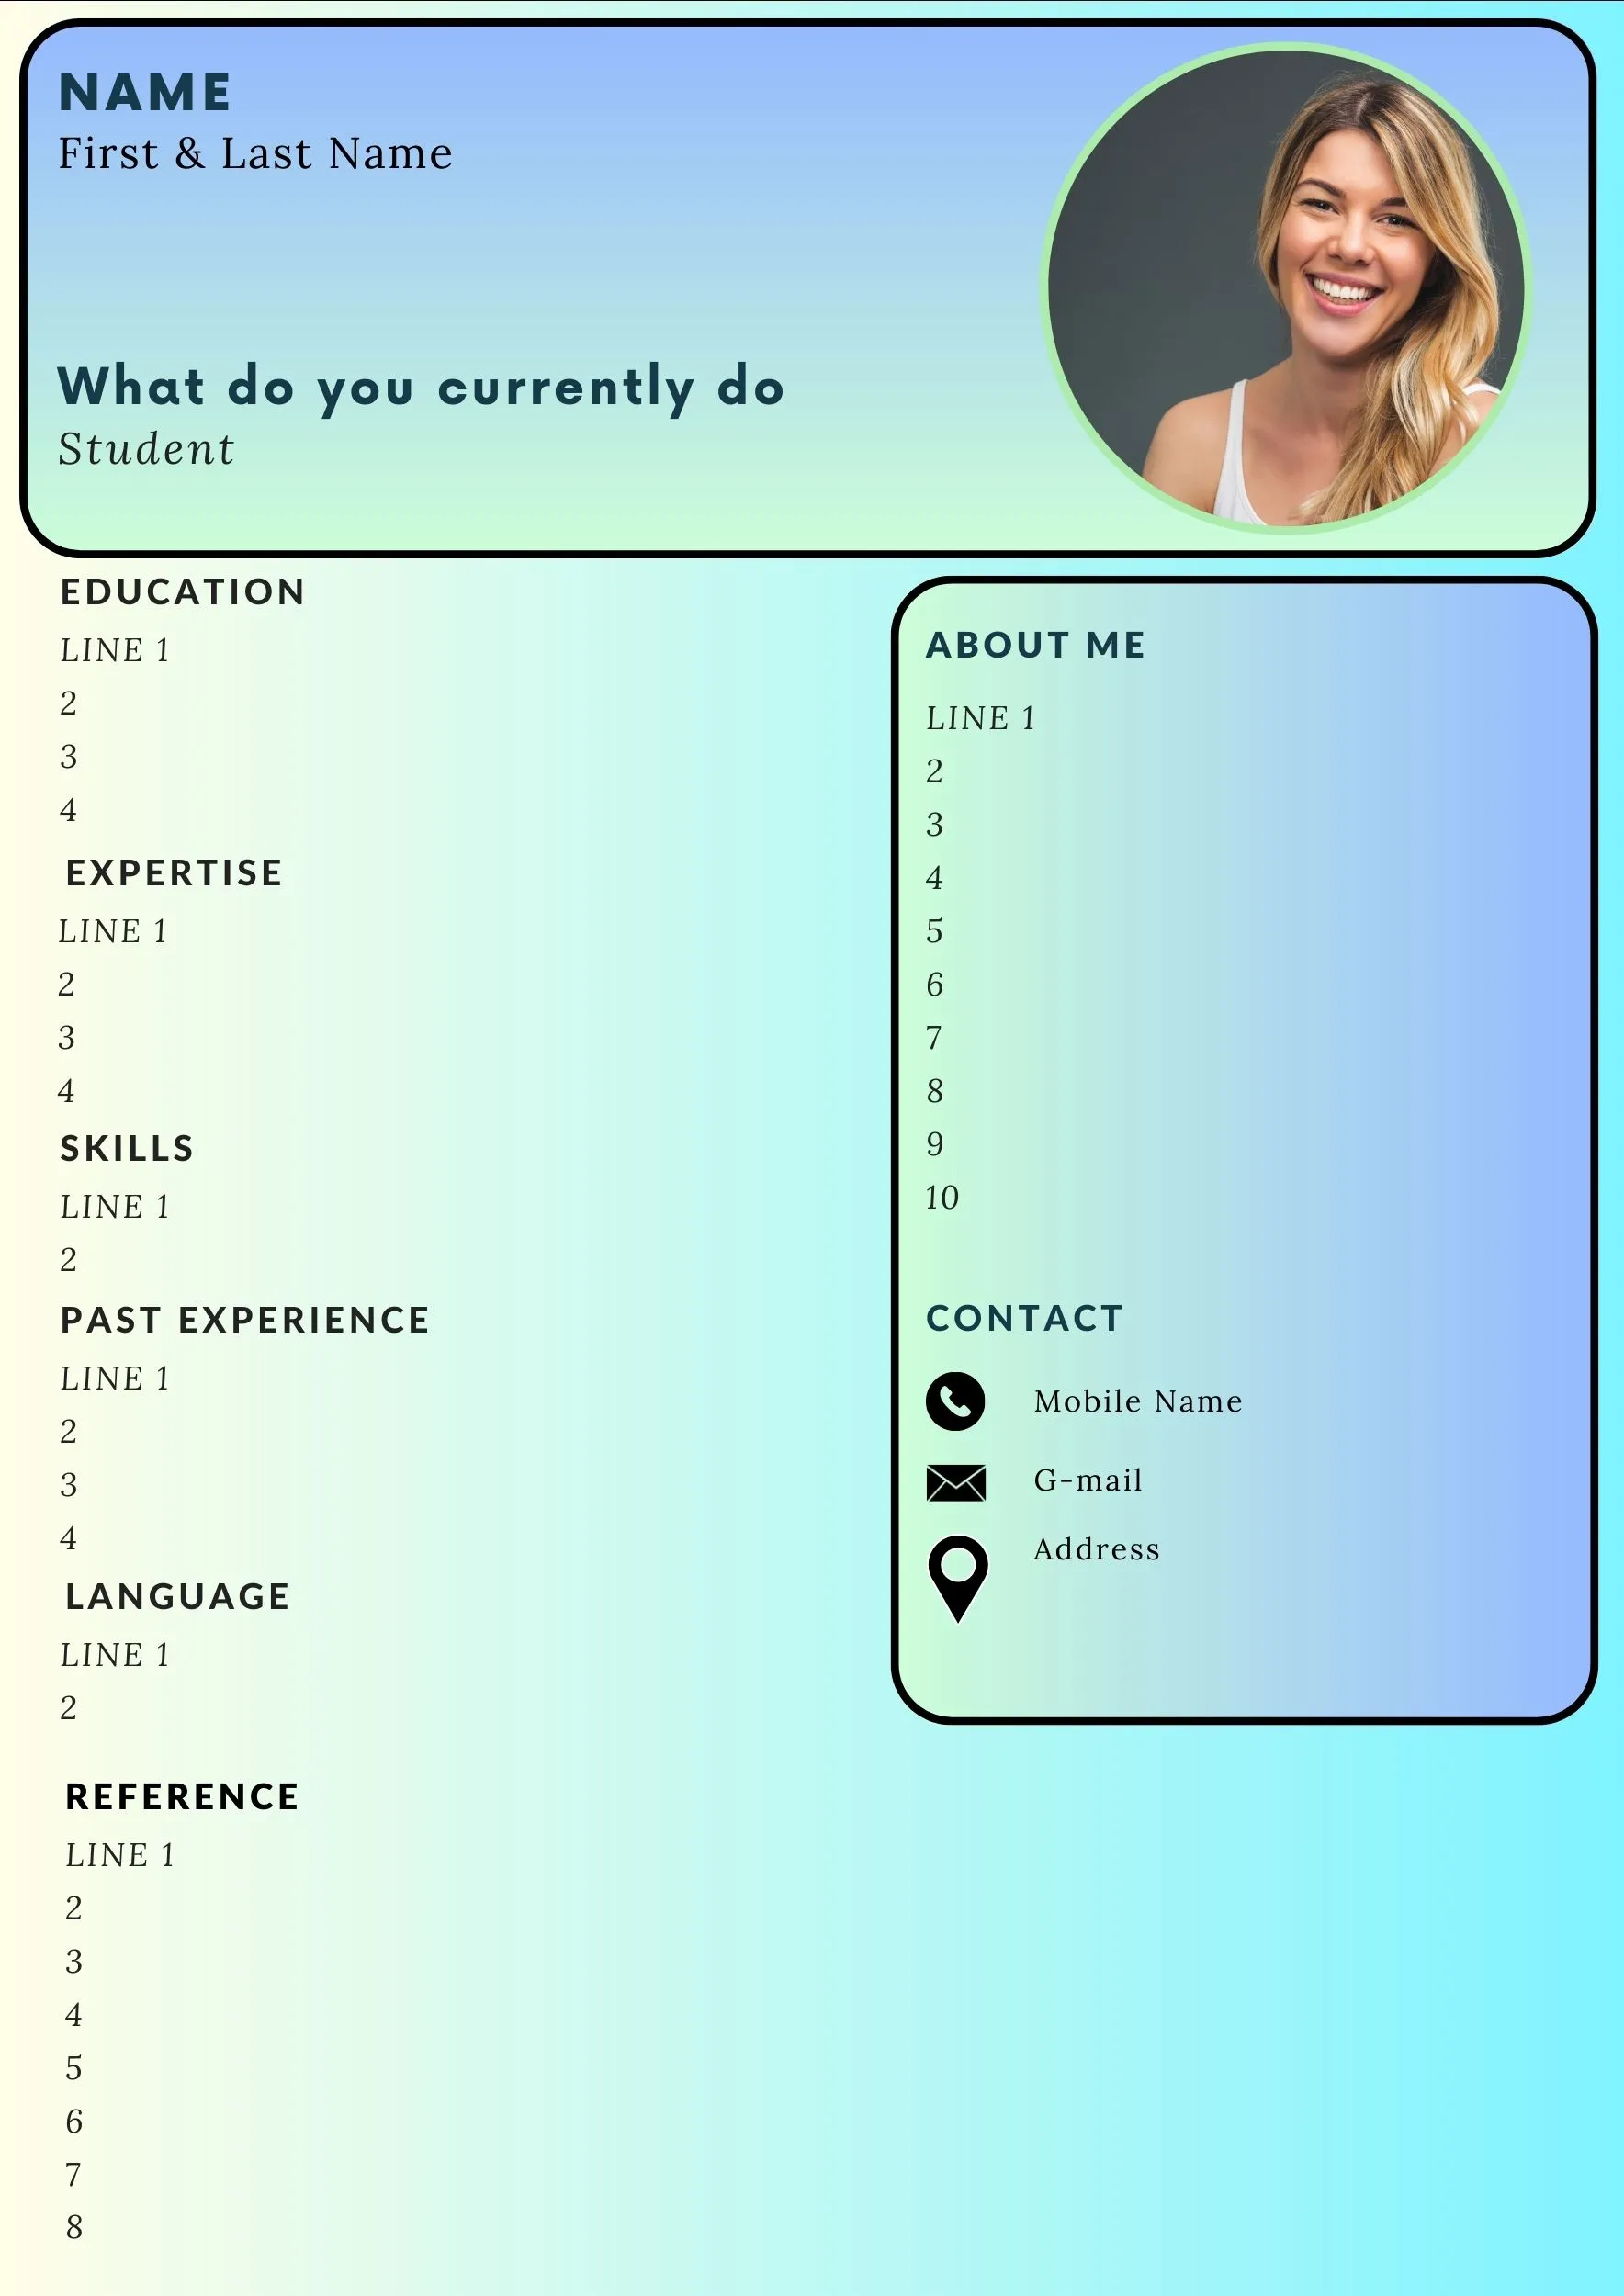
An infographic is a visual representation of information that’s designed to be both engaging and informative. It’s a great way to present your resume in a way that’s easy to read and visually appealing. With a resume infographic template, you can highlight your key skills, work experience, and education in a way that’s both creative and professional.
Data infographics are a powerful tool for communicating information quickly and effectively. By taking complex data and turning it into a visually appealing graphic, data infographics can convey complex information in a way that is far easier to understand and remember.