Creating stunning infographics is now effortless with our pre-designed templates -just pick, personalize, and go. With our infographics, you don’t need design expertise. Simply customize our pre-made Canva templates to suit your exact needs.”
With our Infographics you don't need to know a lot about how to make one. You can edit our pre-made Canva infographics as per your requirement.
Pay What Reflects Your Value" Our core mission is to make these life-changing self-improvement tools accessible to everyone, regardless of their current path.
Know your one-of-a-kind canva Infographics template from down below.


All pics, texts, sub-headings, headings, fonts, colours, backgrounds, texts sizes, everything can be edited.
In order to determine which template will be most helpful to you, let's briefly understand what the task entails.
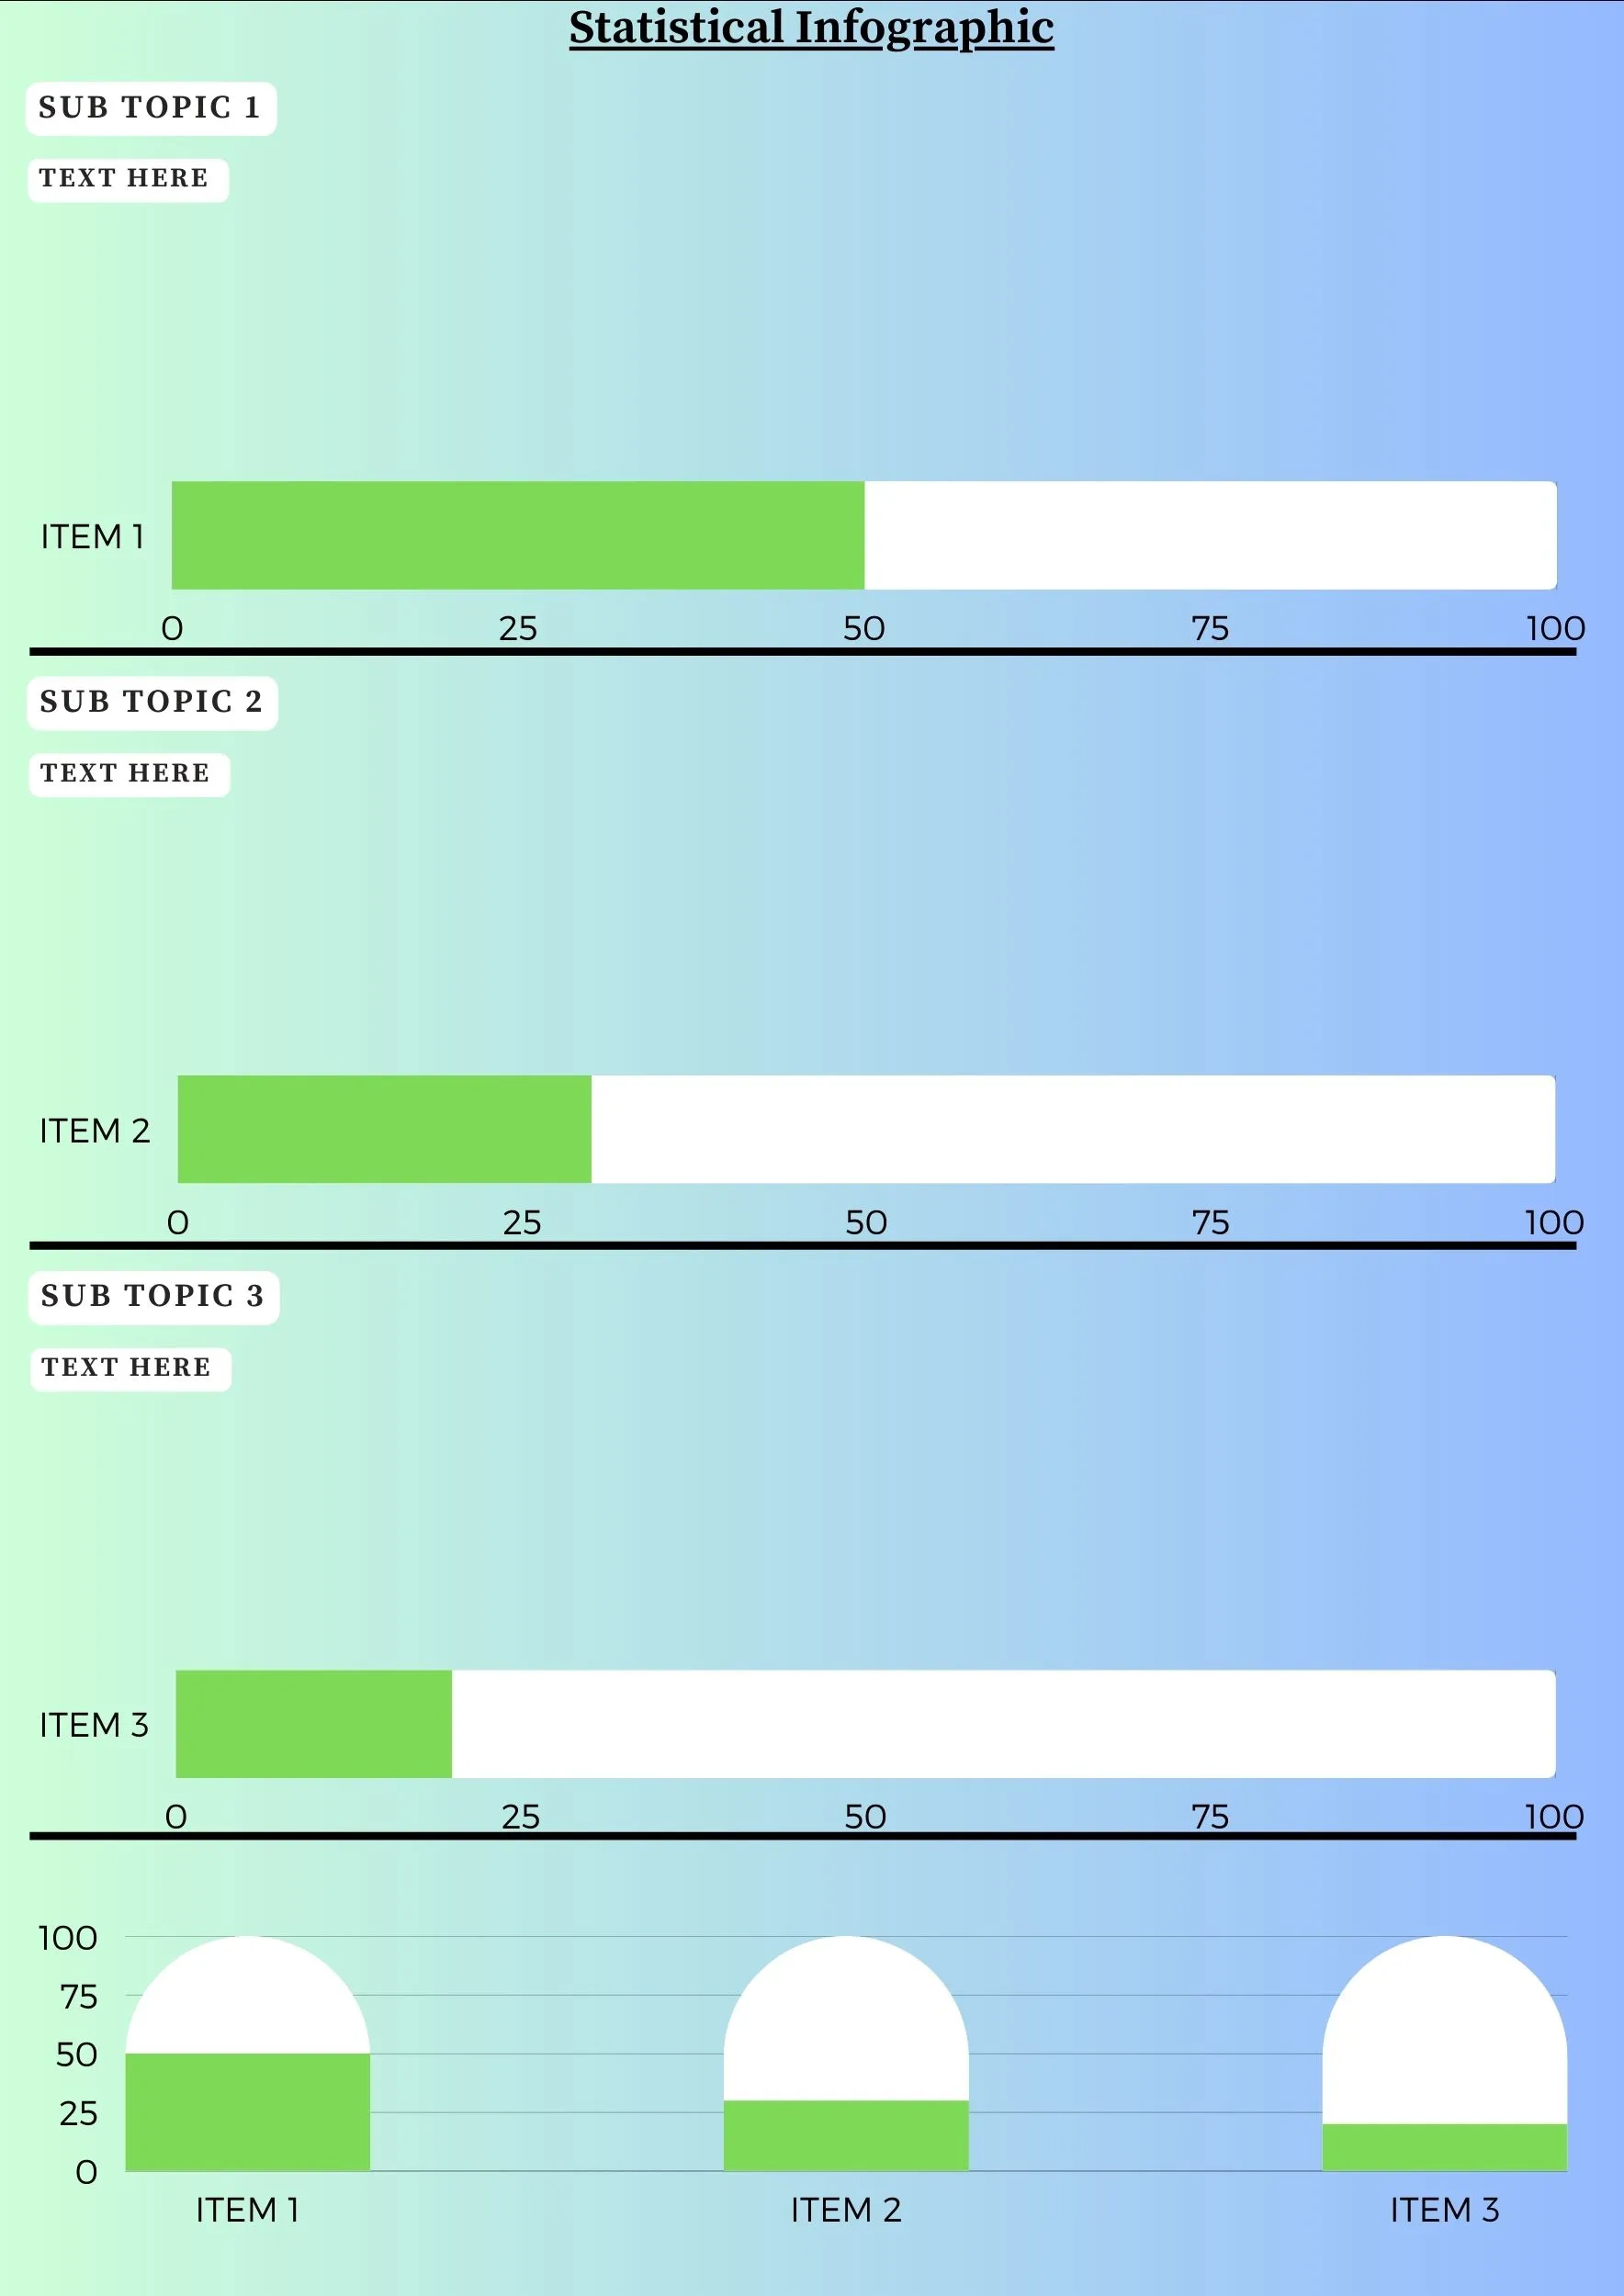
Statistical / Mixed chart
Are you looking to present your data in a more impactful way? Statistical / Mixed charts are the perfect solution for you! Not only do these charts provide a visually appealing way to display your data, but they can also provide valuable insight into trends, correlations, and other patterns in the data.
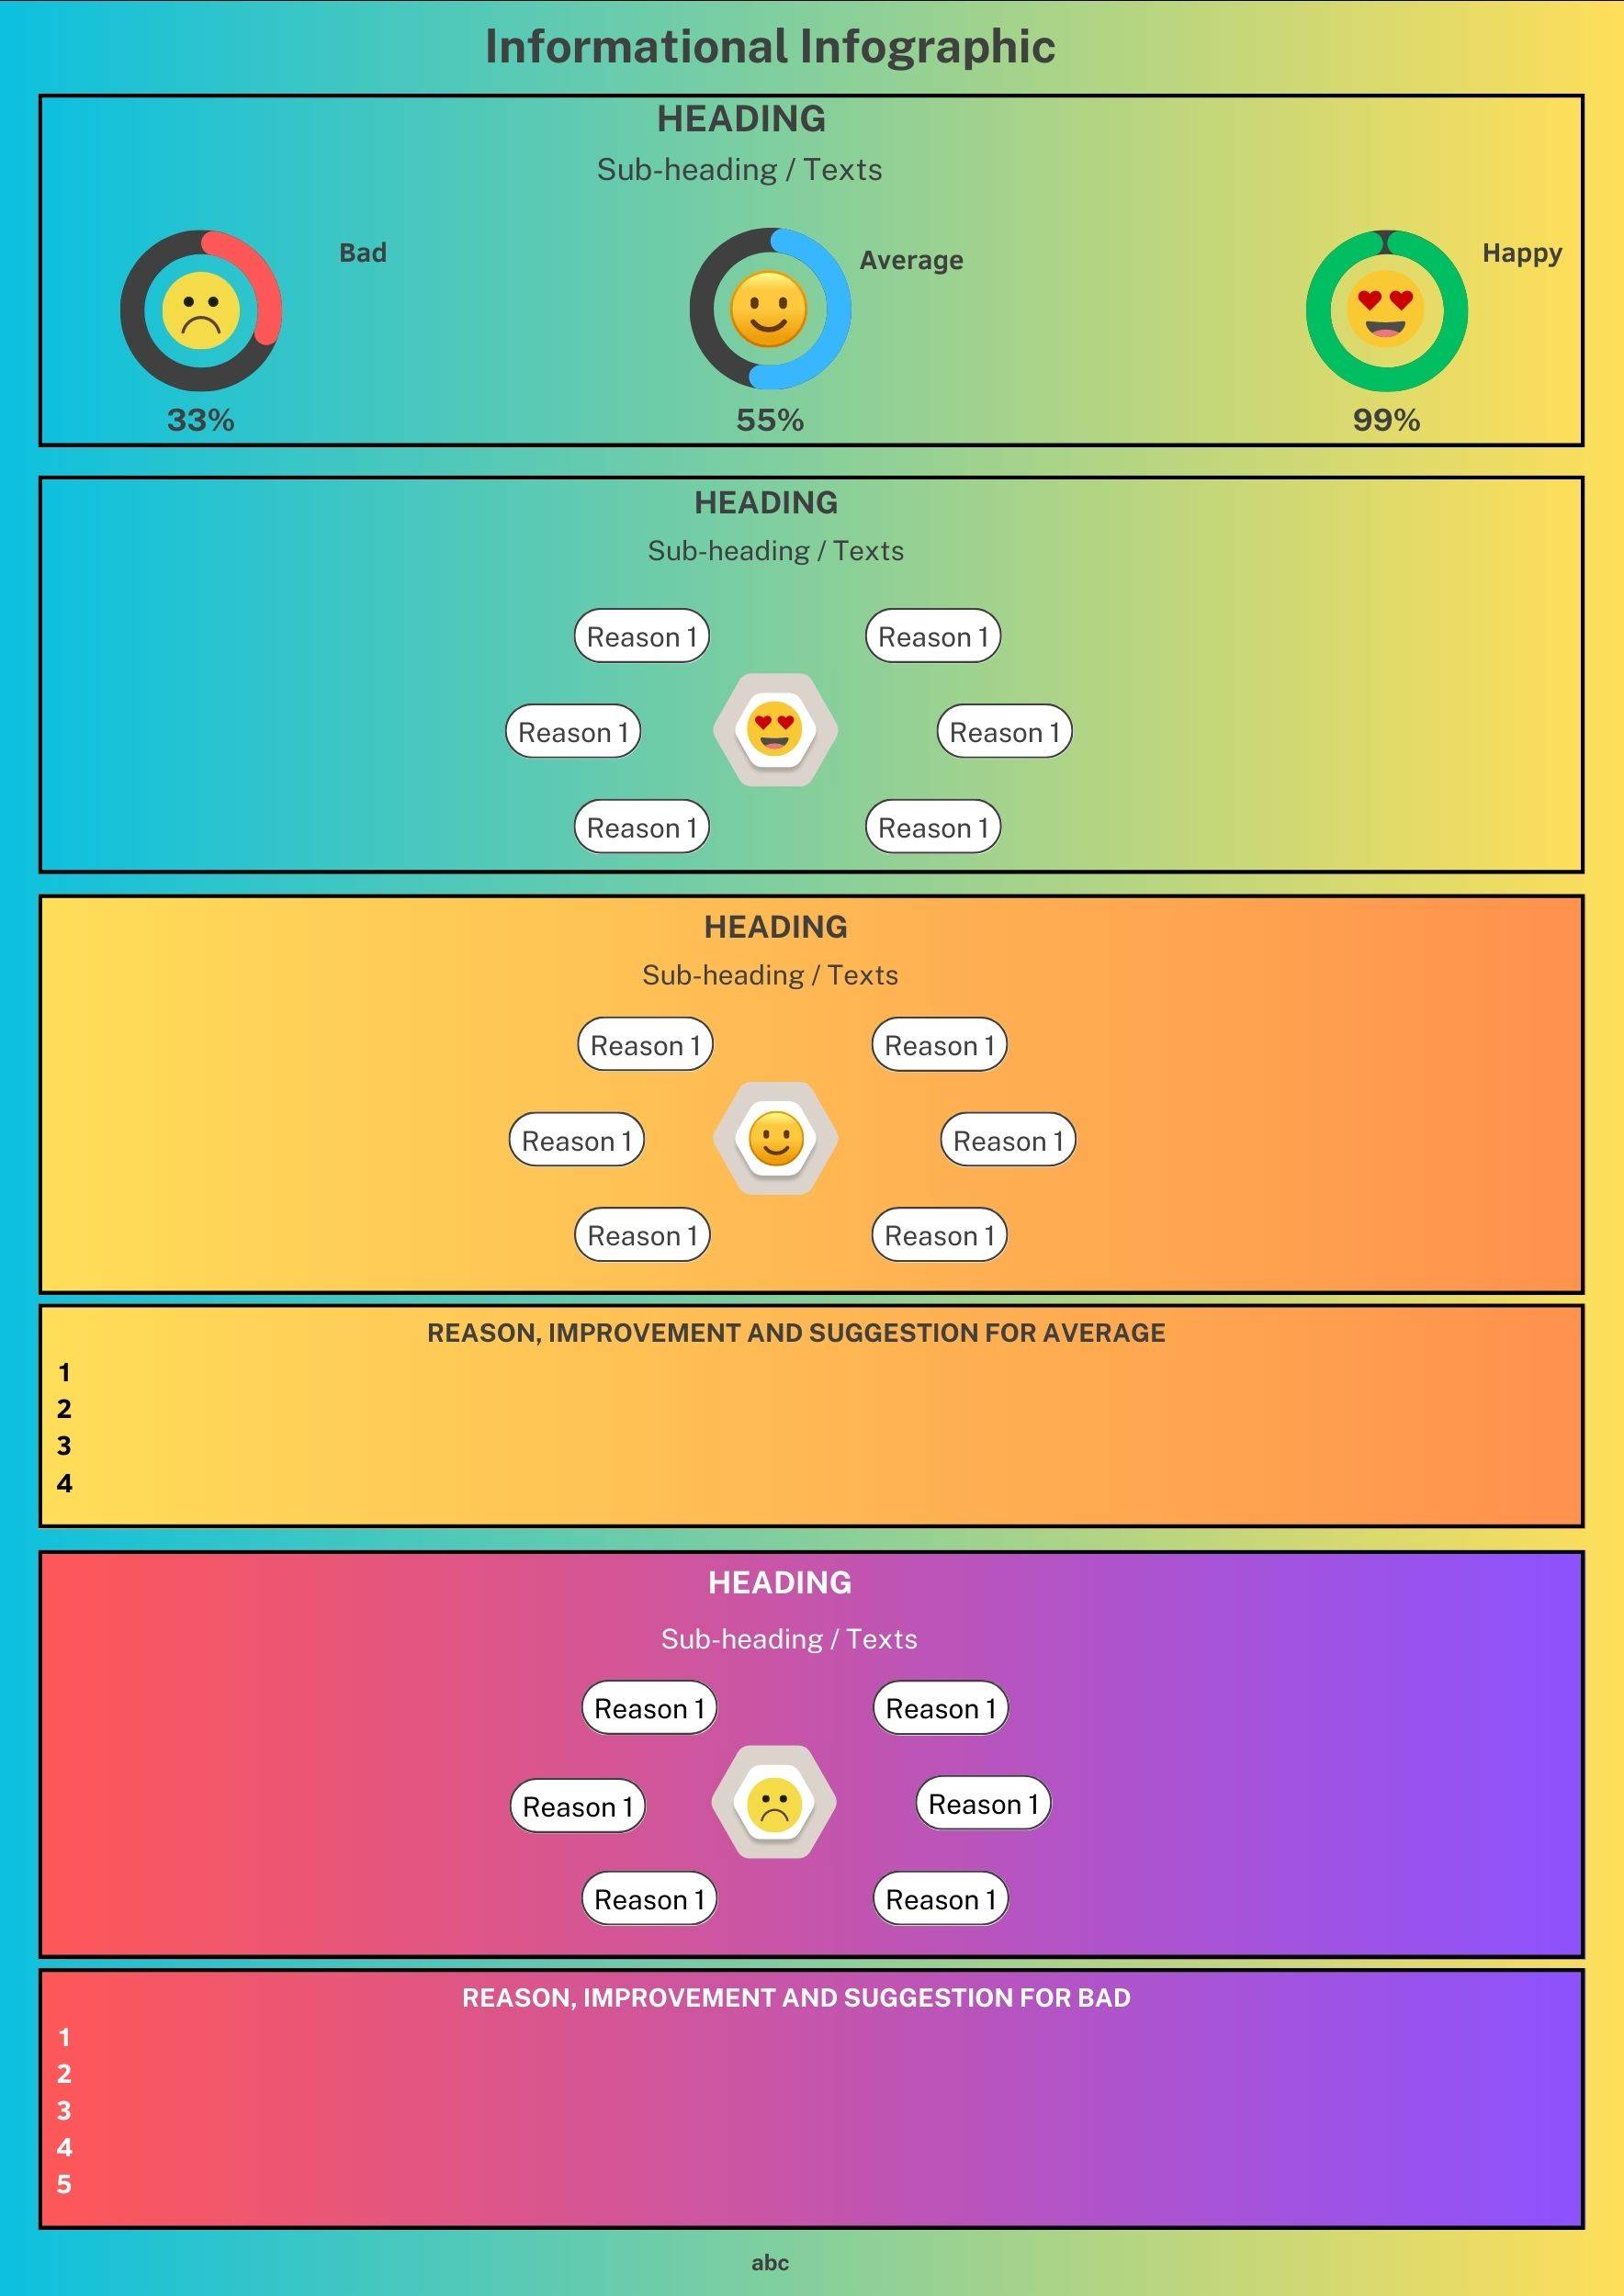
Informational / List
A list infographic, or an informational infographic, is a type of infographic that is popular for presenting information in a visually appealing and consumable manner.
Timeline
A timeline infographic is a visual representation of events, processes, or projects that have occurred over a specific period. This template is used to organize and display information in chronological order to make it easier for viewers to understand the progression of events.
How-to / Guide
A guide infographic is a type of infographic that presents information in a step-by-step format. It is designed to guide readers through a process or procedure, providing clear and concise instructions at each stage.
Process
A process infographic is a pre-designed layout that provides a framework for creating a process infographic quickly and easily. It helps you to organize your thoughts and ideas and present them in a clear and concise way.
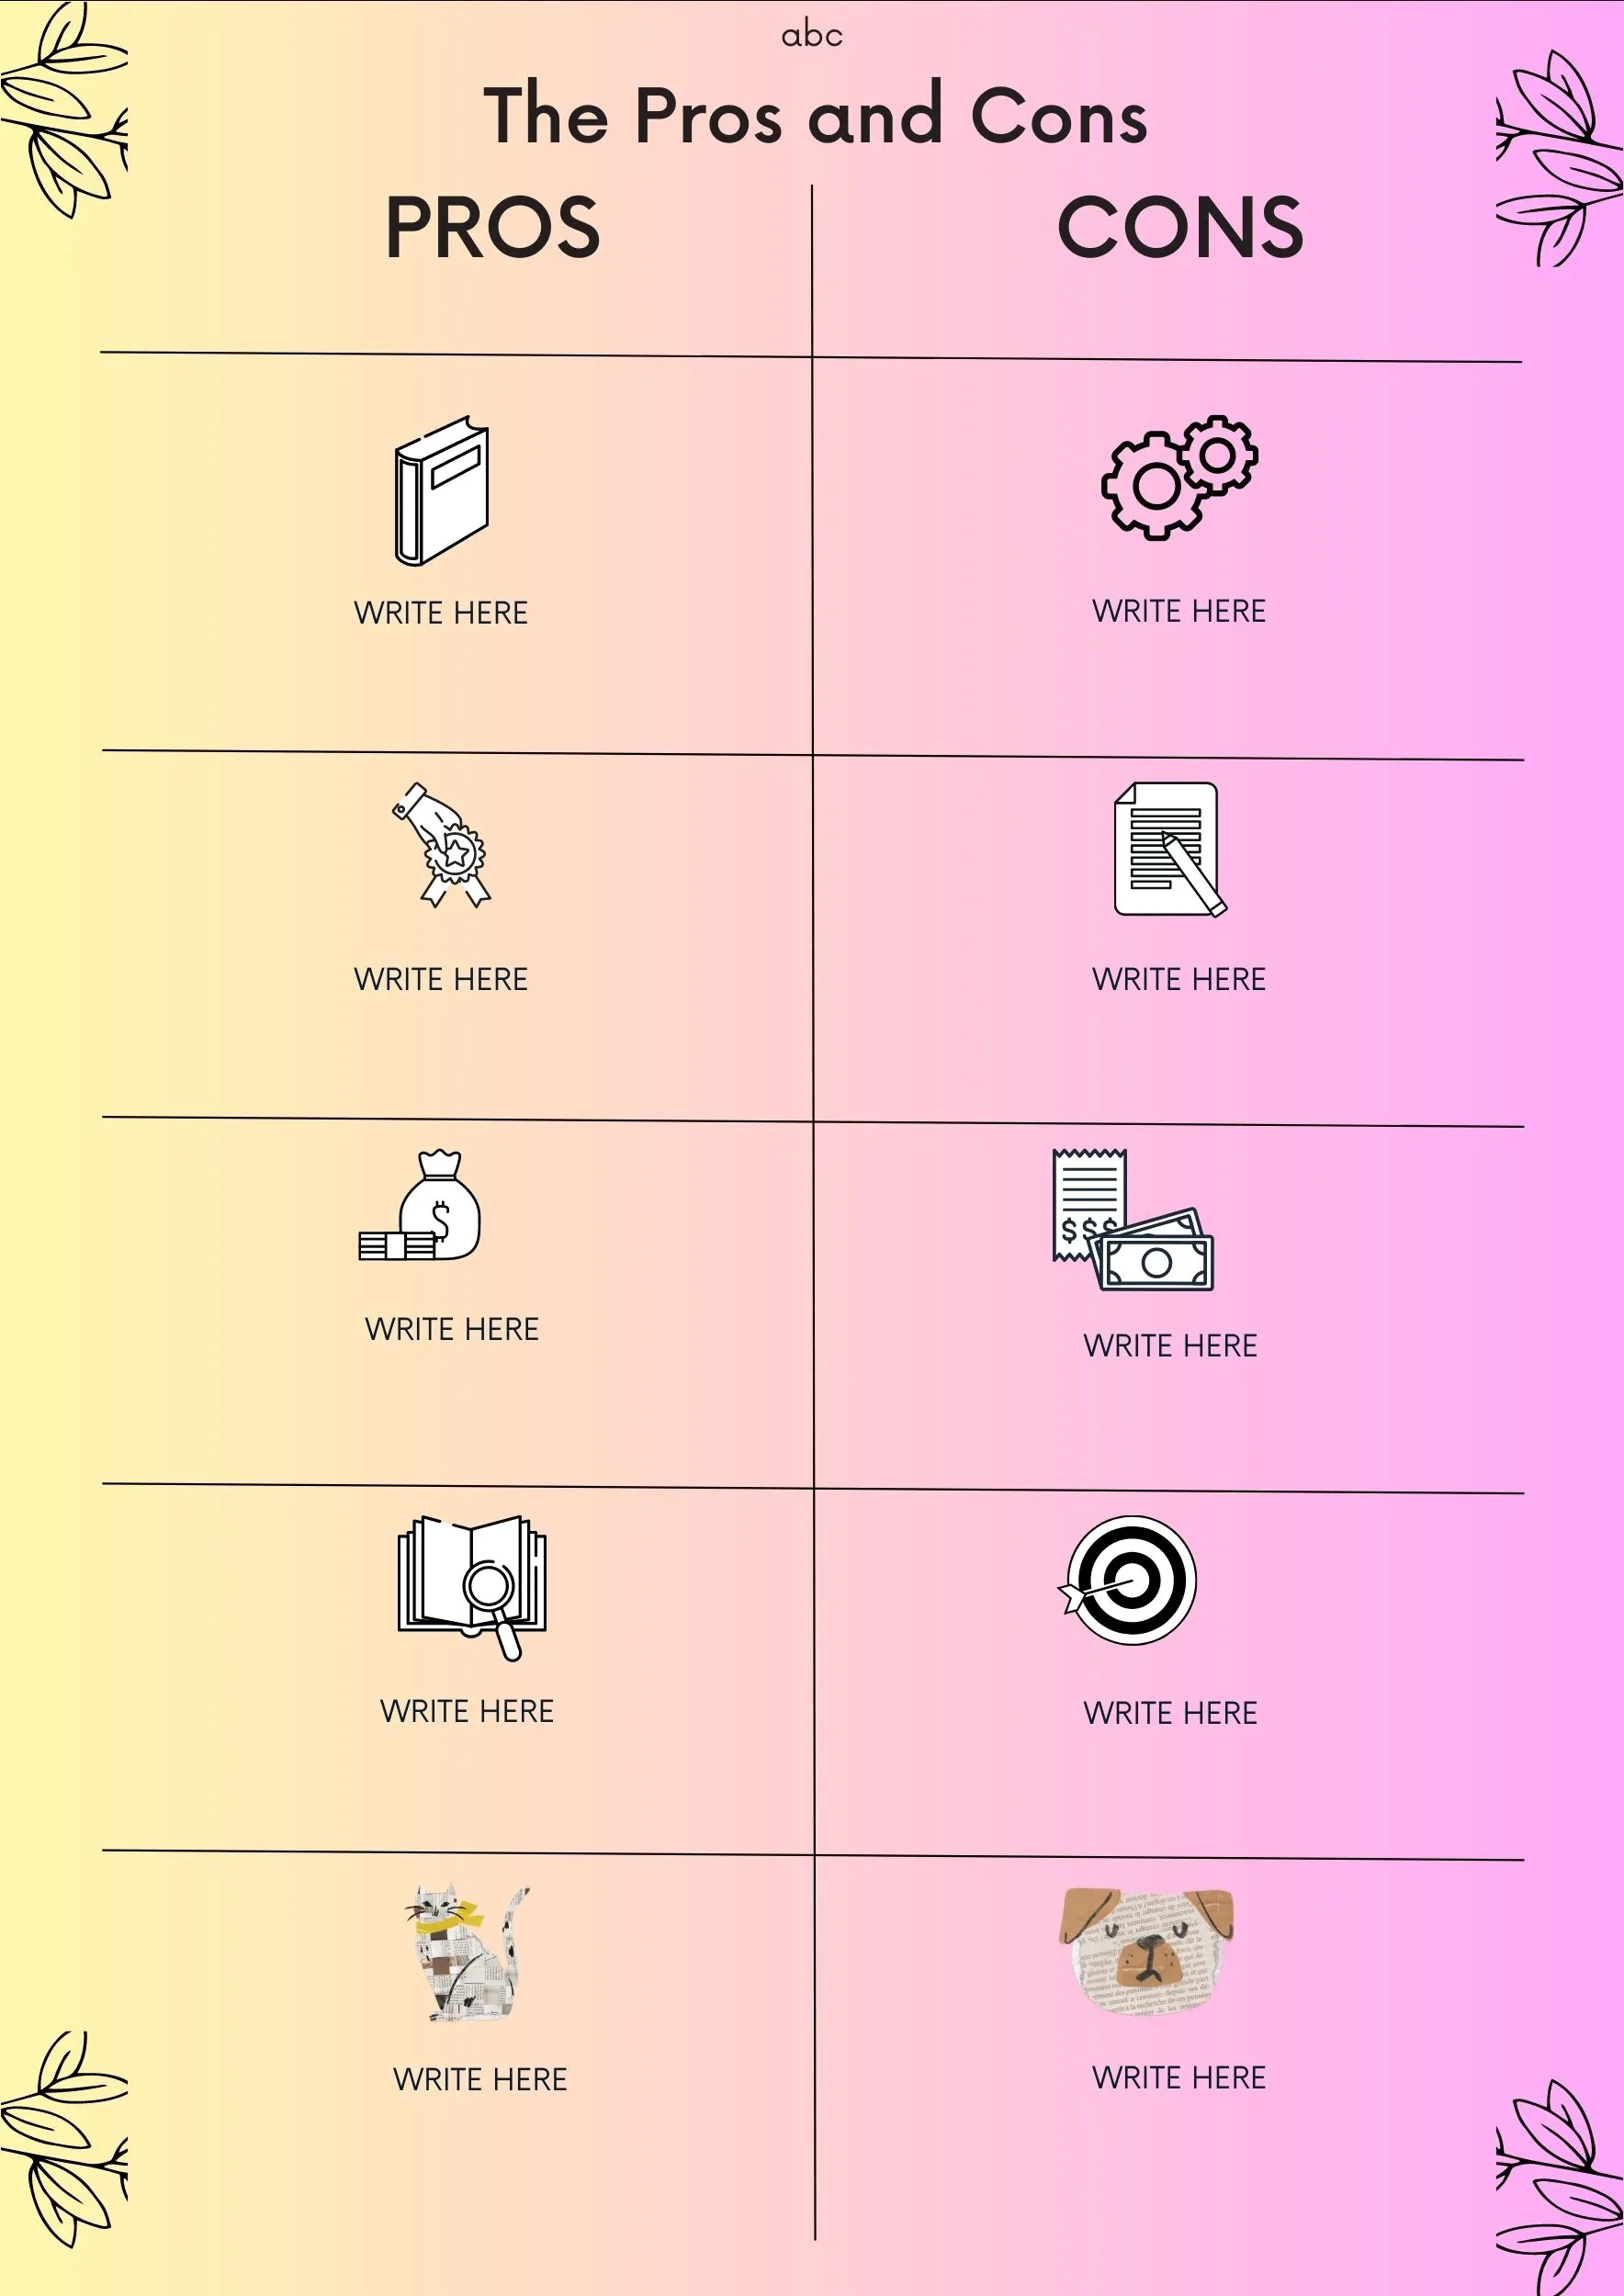
Comparison
A comparison infographic can be a valuable tool for creating engaging and informative infographics quickly and easily. These templates typically include pre-designed layouts, graphics, and icons that can be customized with your own data and information.
Location / Map
A location or map infographic is a perfect example of this. It displays data related to geography, locations, and maps in a visually appealing way.
Flowchart
Flowchart Infographic is a graphical representation of a process or system, where steps are represented by symbols or shapes that are connected by lines or arrows. This visual tool is used to simplify complex concepts and make them more understandable.
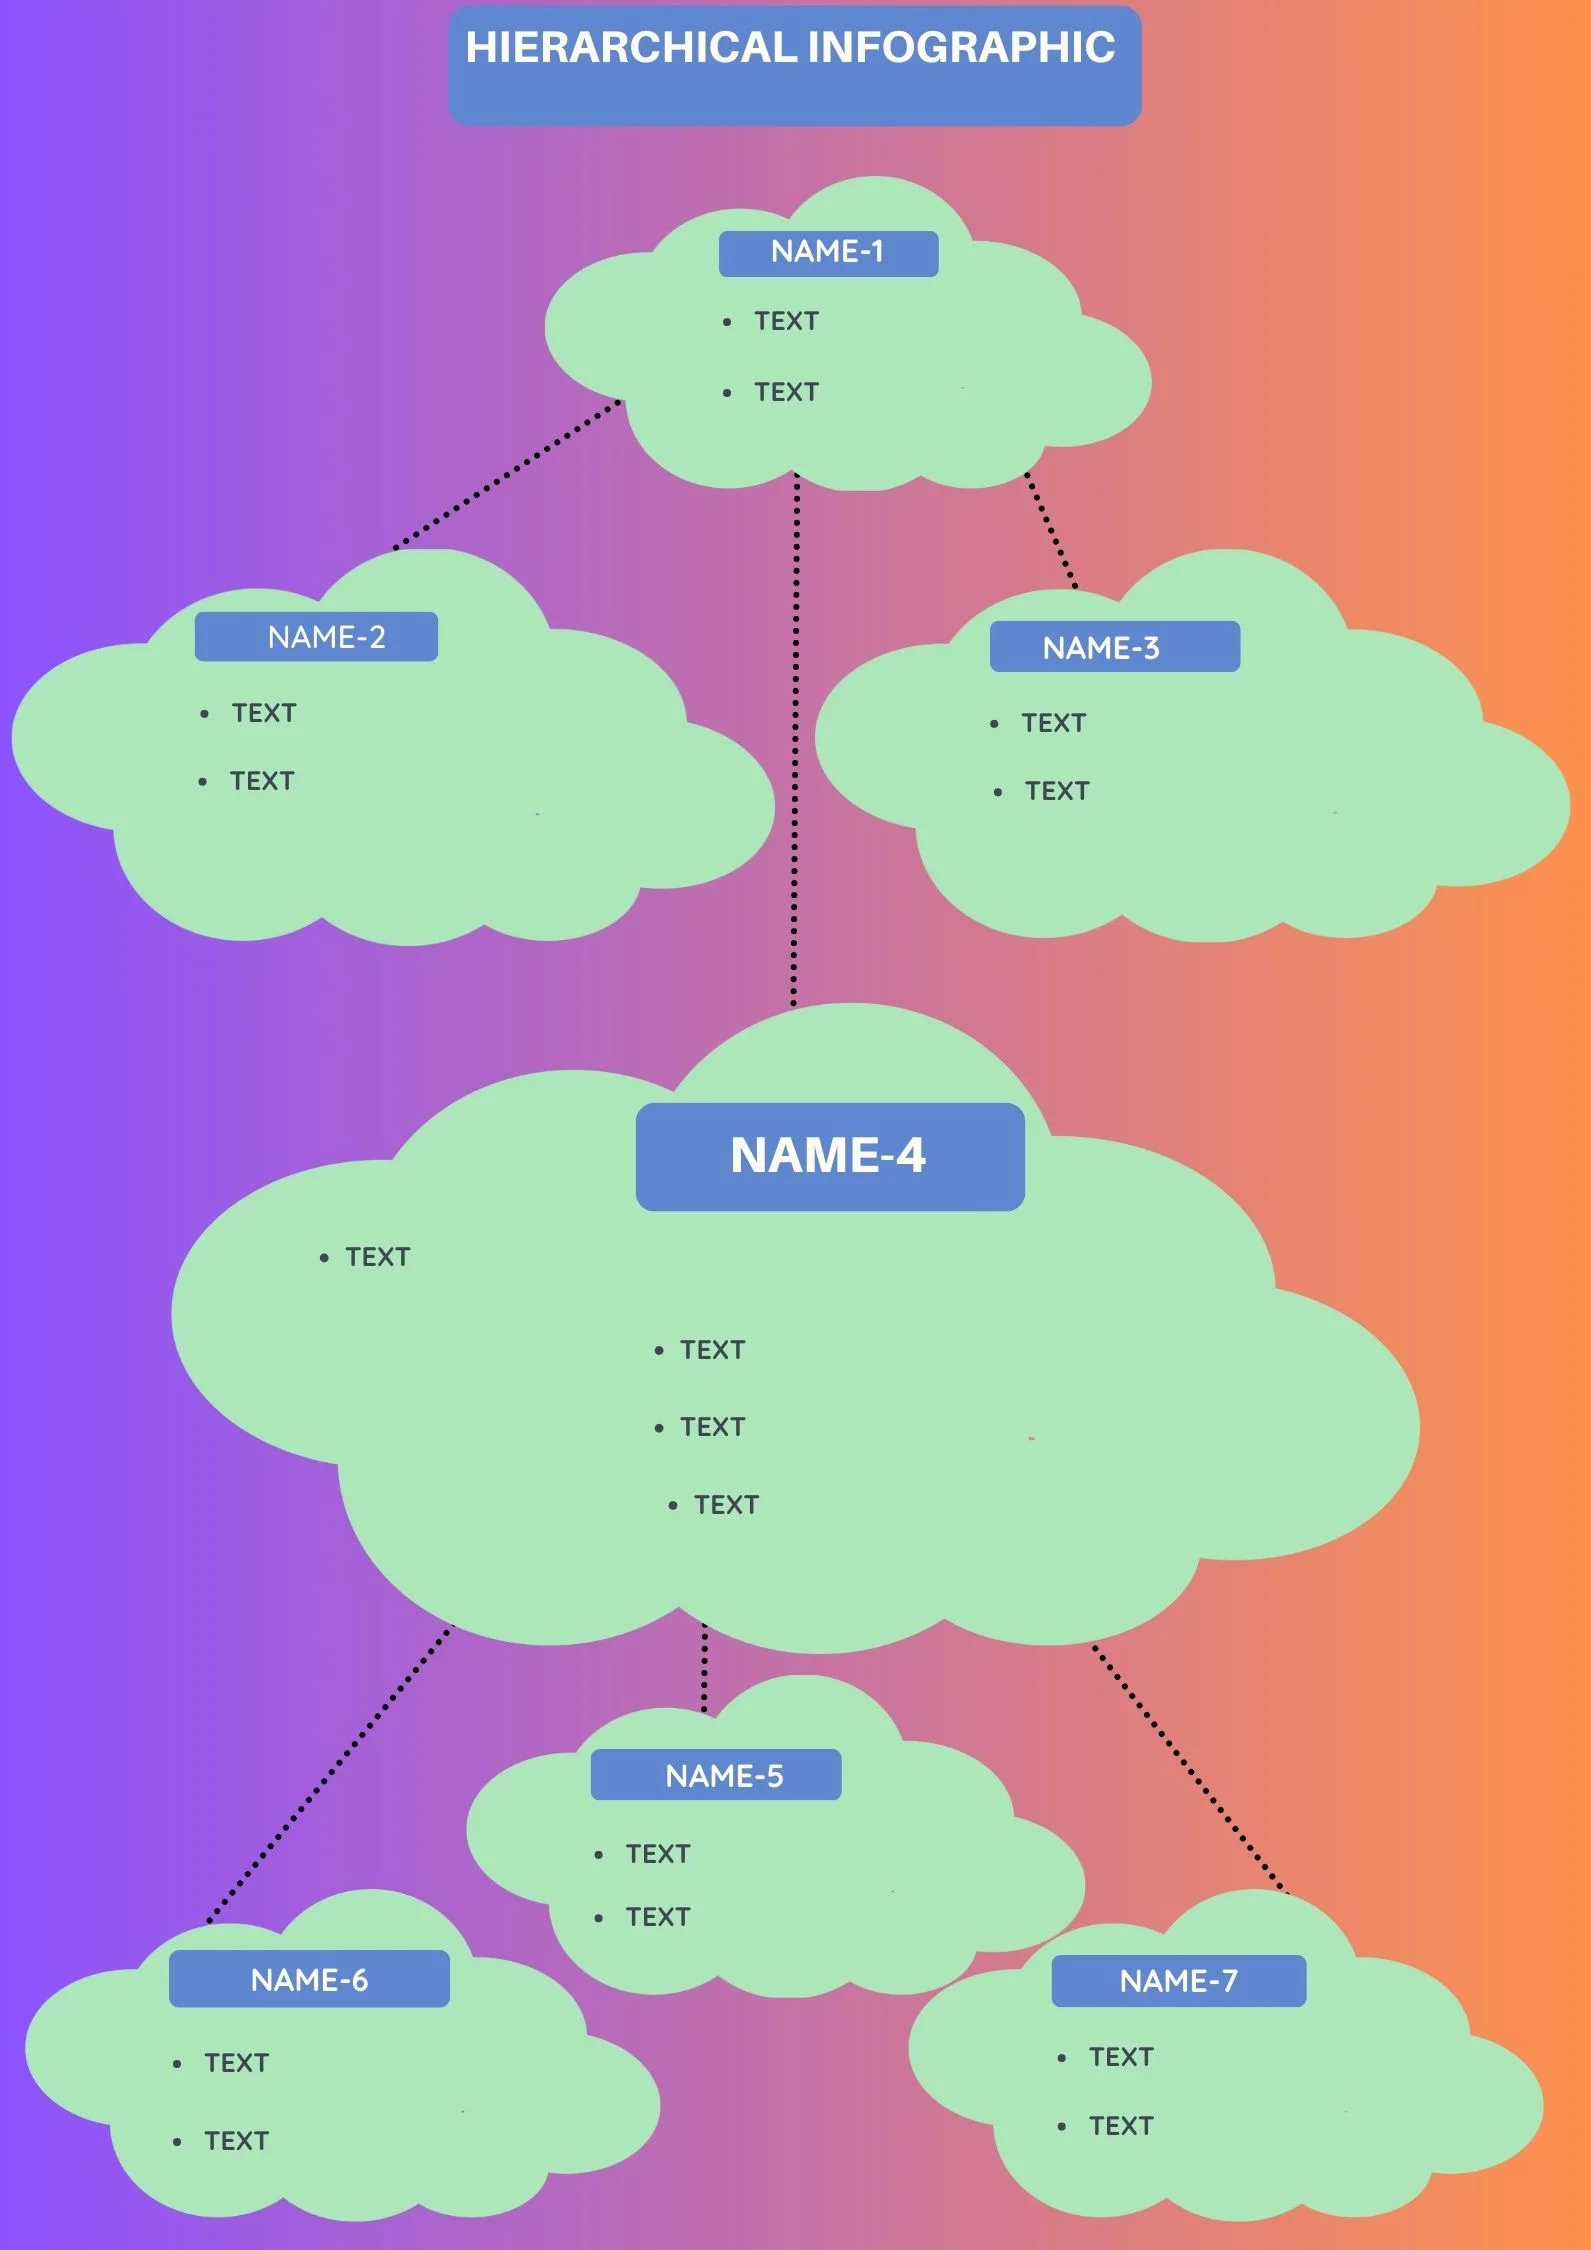
Hierarchical
A Hierarchical Infographic is a visual representation of a hierarchy of information. It typically features a main central graphic that represents the top-level information, with secondary graphics and information branching out from it.
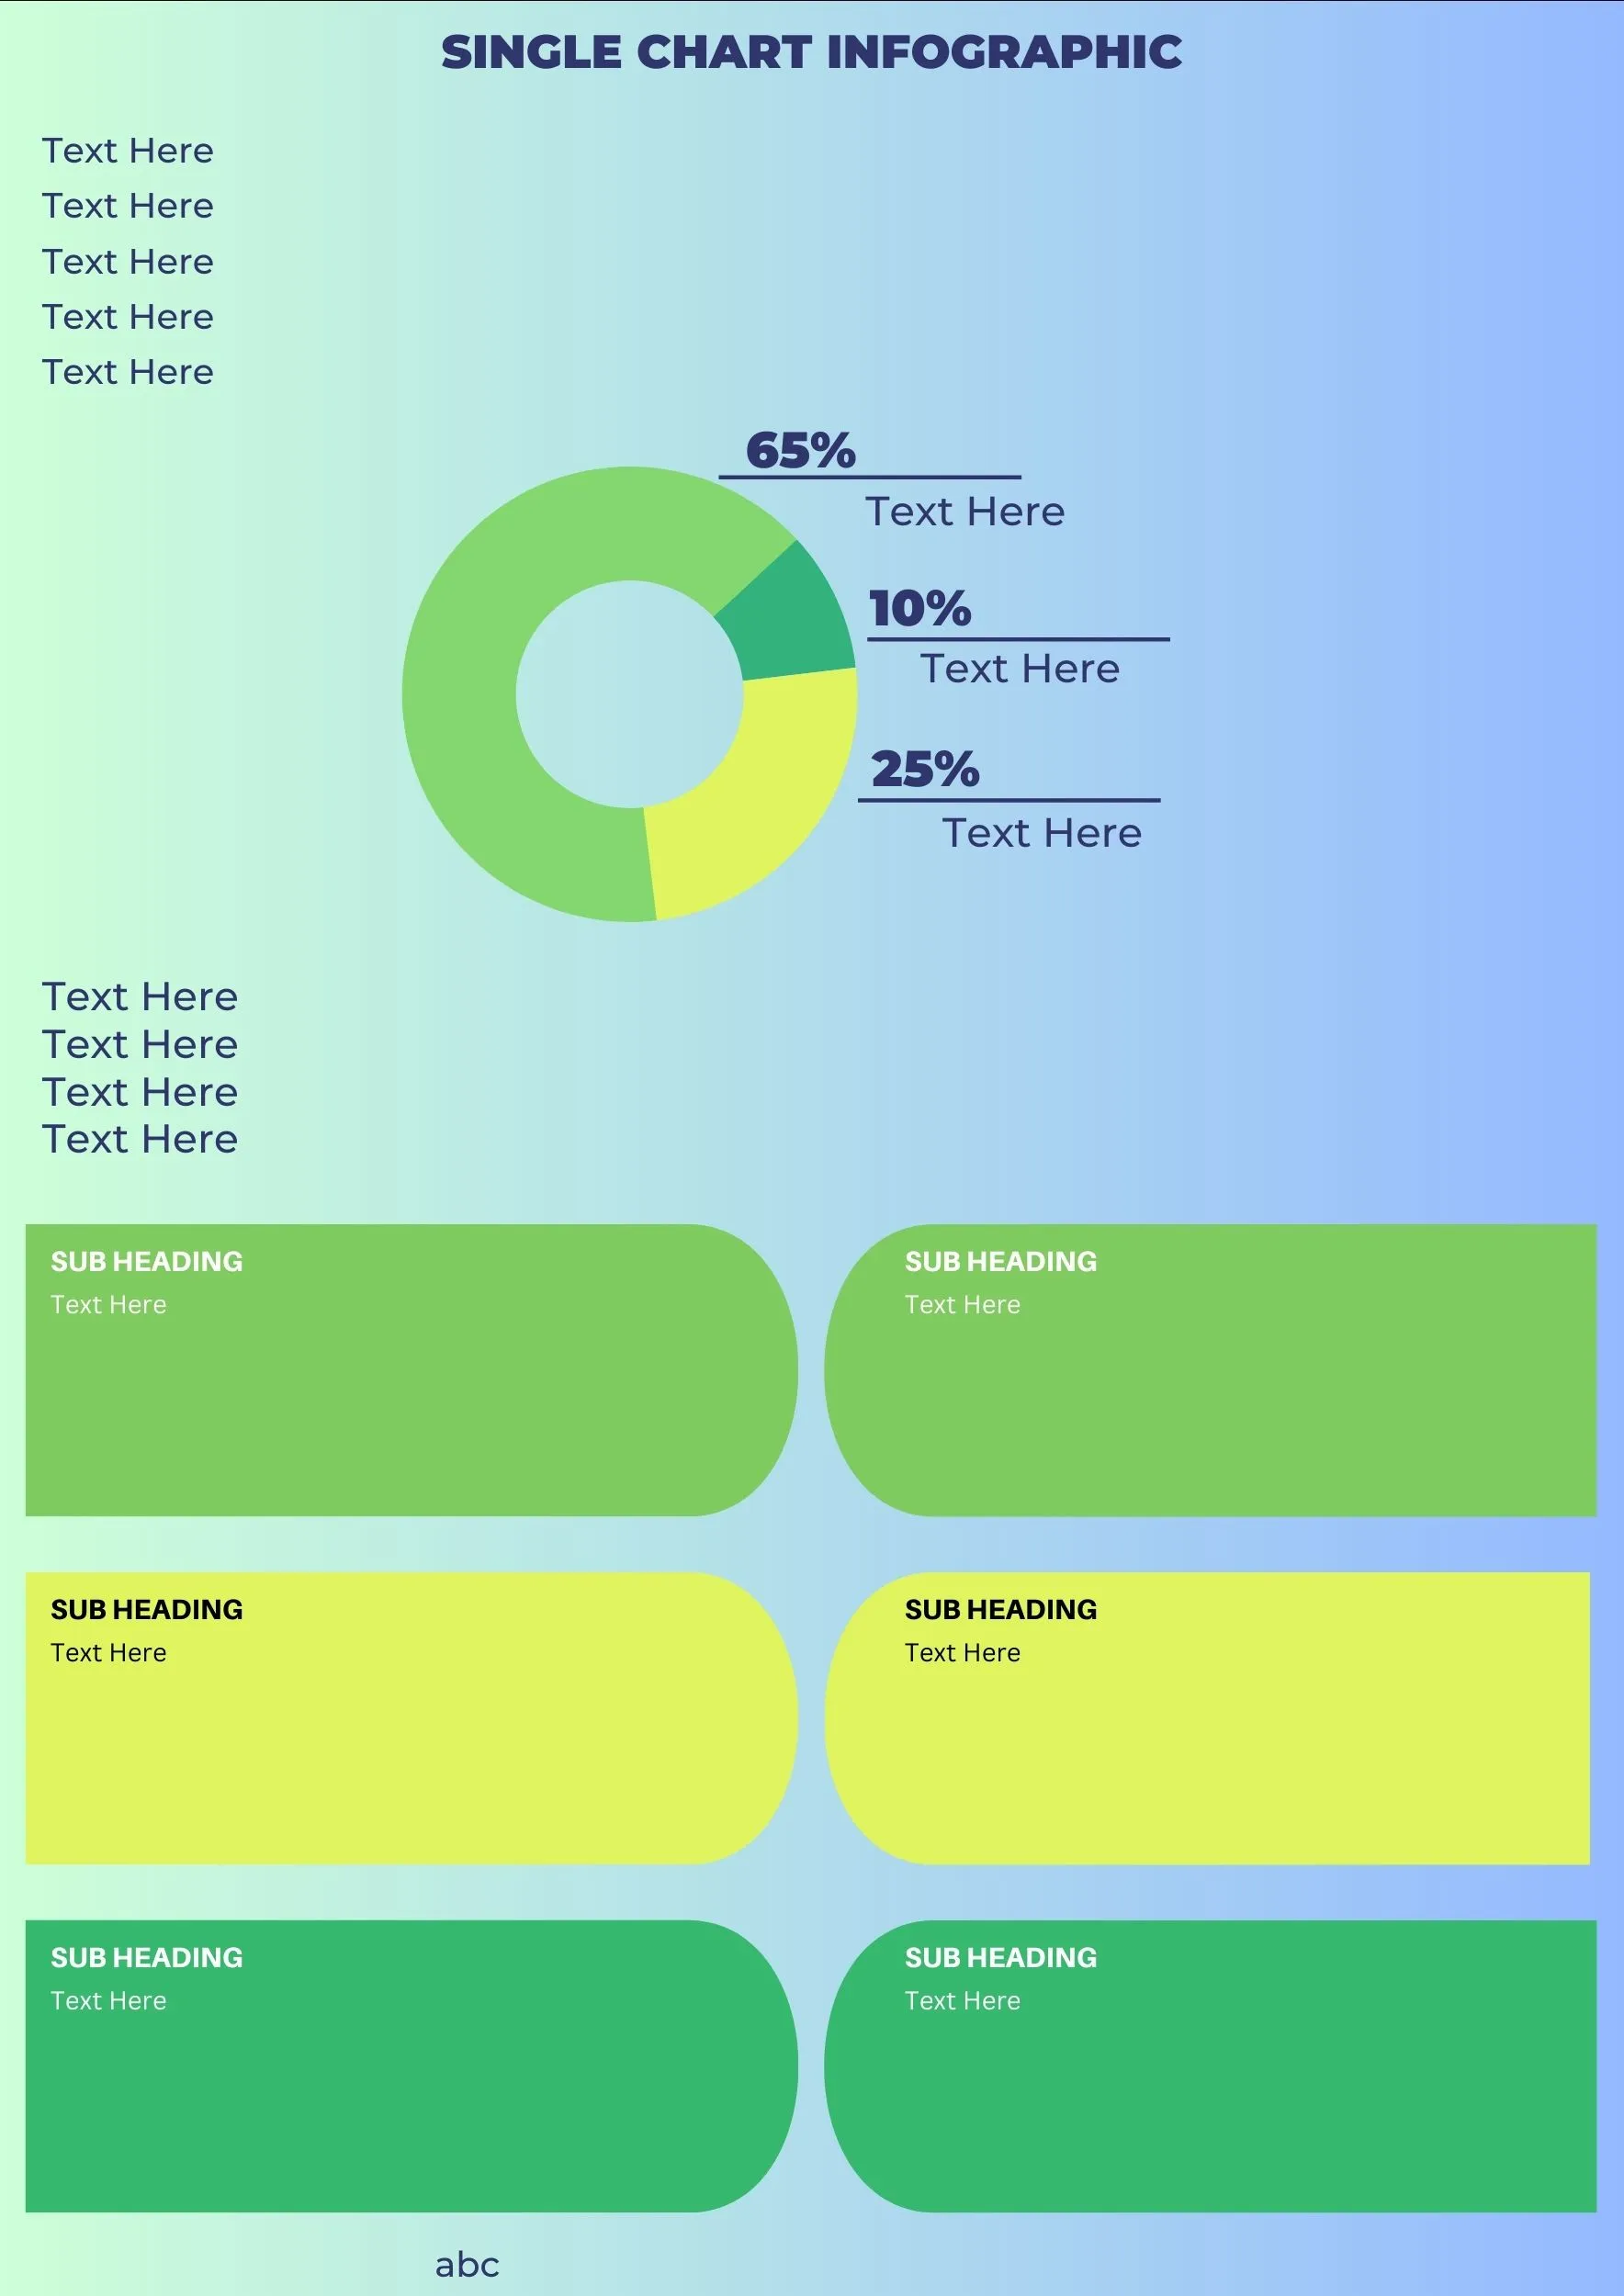
Single Chart
A single chart infographic is a design that presents a single chart or graph in a visually appealing and easy-to-understand format. The chart can be anything from a line graph to a bar chart, and the data can relate to any topic, from sales figures to website traffic to social media engagement.
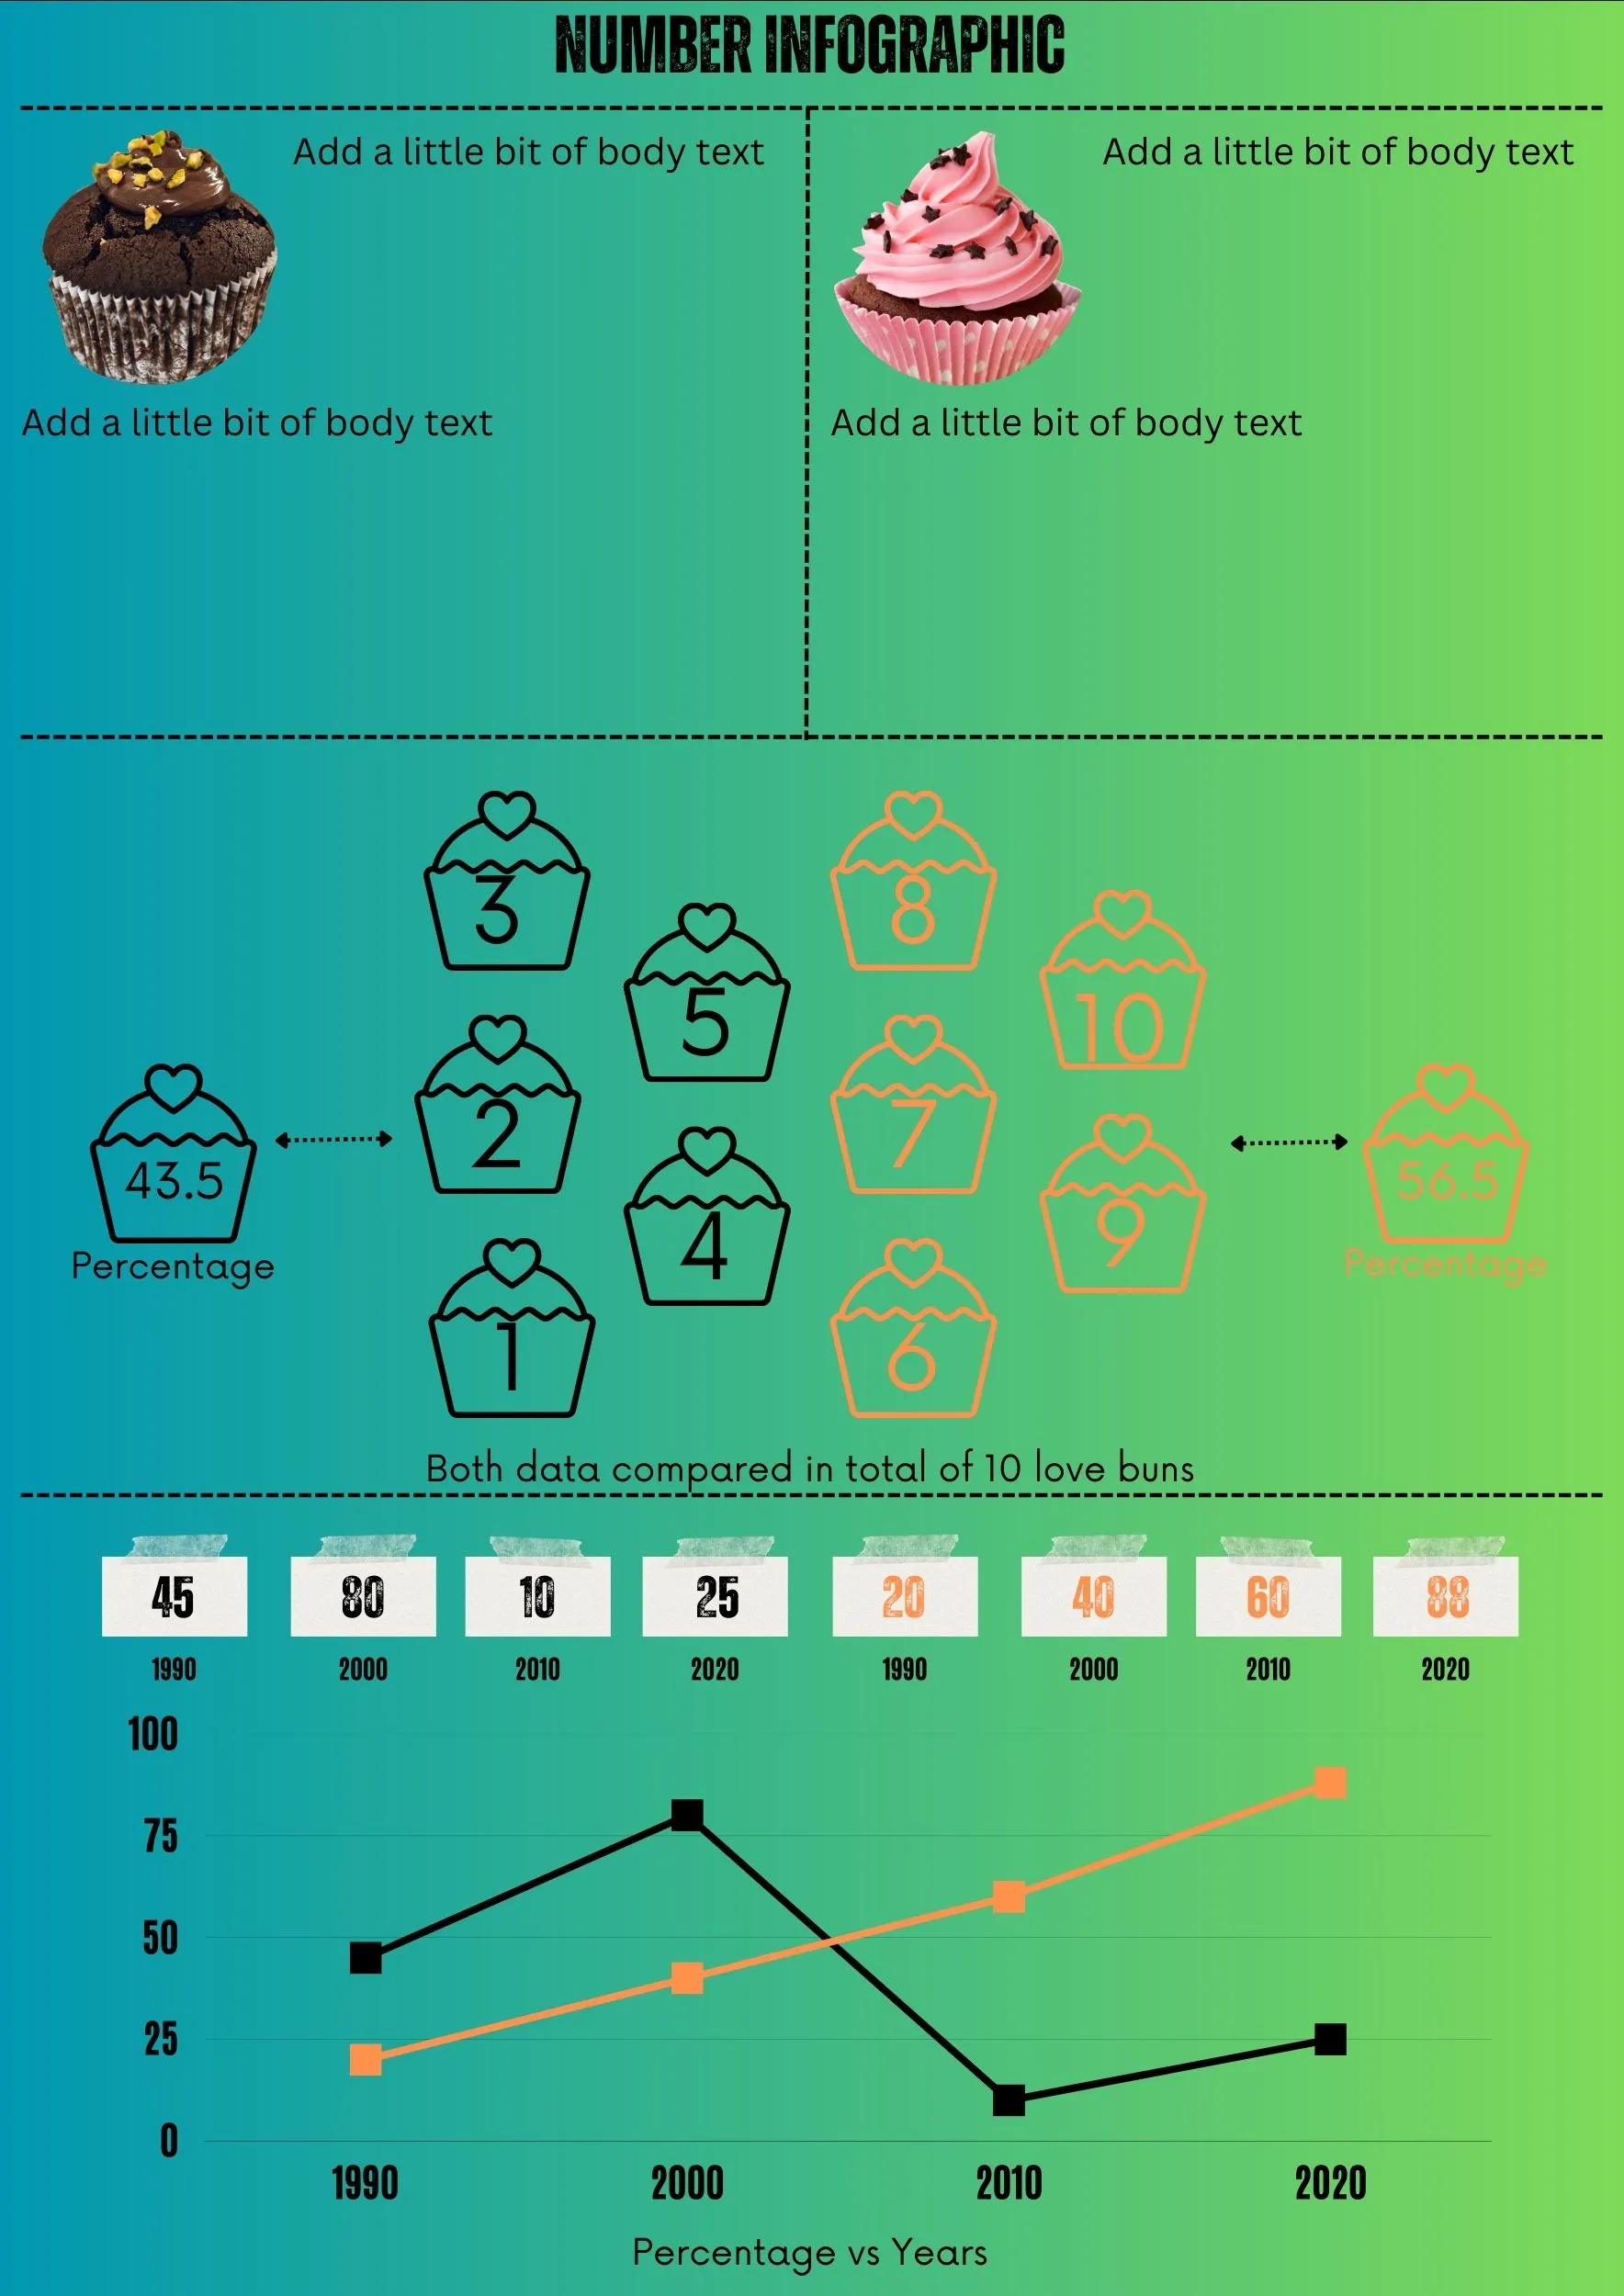
Visualized Numbers
A visualized numbers infographic is a type of data visualization that uses images, icons, and other graphical elements to represent numerical data.
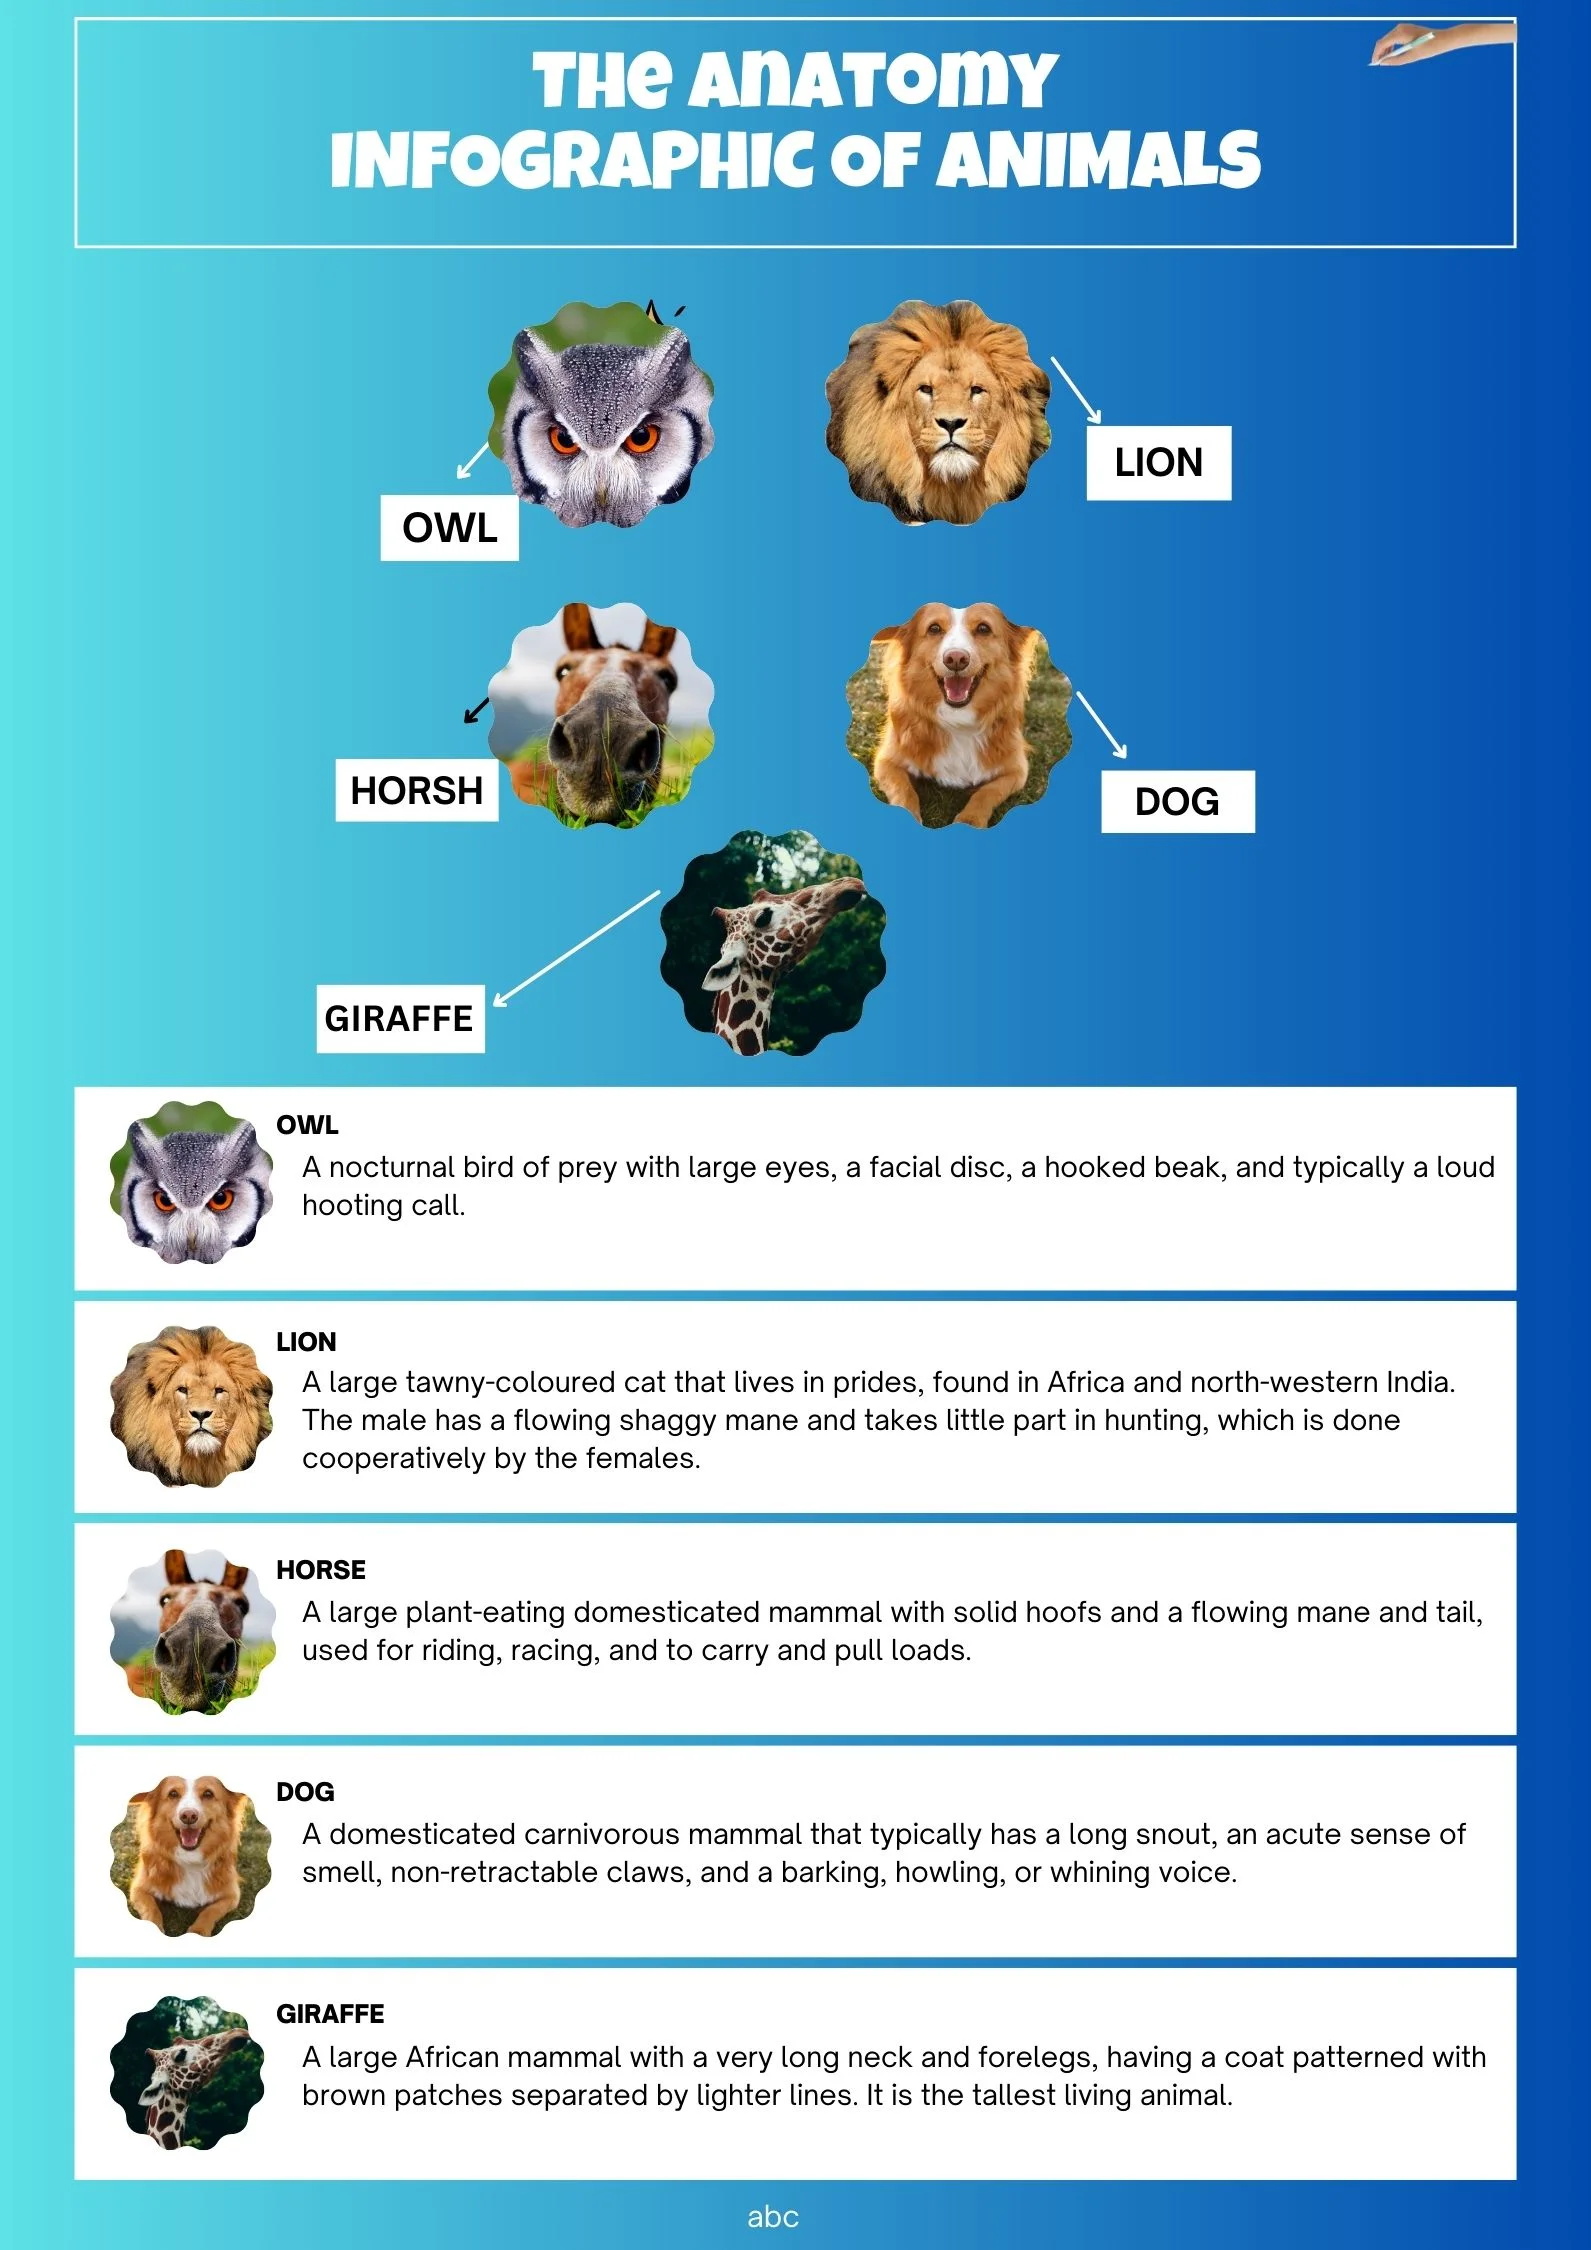
Anatomical
As a visual learner, I find that infographics are a great way to convey information in a clear and easy-to-understand way. An anatomical infographic can be particularly useful for students or healthcare professionals looking to create a visual aid for a presentation or study material.
An anatomical infographic typically includes labeled illustrations of various body parts and systems. This can range from a simple diagram of the heart and its chambers, to a more detailed breakdown of the skeletal system and its different bones.
Resume
An infographic is a visual representation of information that’s designed to be both engaging and informative. It’s a great way to present your resume in a way that’s easy to read and visually appealing. With a resume infographic, you can highlight your key skills, work experience, and education in a way that’s both creative and professional.
Data
Data infographics are a powerful tool for communicating information quickly and effectively. By taking complex data and turning it into a visually appealing graphic, data infographics can convey complex information in a way that is far easier to understand and remember.
Looking to blend multiple infographic styles into one? Or perhaps you need a completely custom design that perfectly fits your project uniquely yours from start to finish.
Contact us using our social site to request your custom order or for discussing your ideas.
Top Tier Access For subscriber and contributor.
Doesn’t matter if you pay through any links which have custom payment options, and it doesn’t matter if it’s a one-off, monthly, or whatever frequency suits you.
Either way, you’re part of our monthly delivery cycle. Pick whatever fits:
One-Time : support once, in any amount, anytime, at your convenience. And if you bought our pre-made or ordered custom digital products, you’re already part of it.
As a subscriber or contributor, you automatically get Top Tier access.
Your first delivery lands within a few hours of payment, just to confirm you’re in. It will have the goodies. After that, you’ll get next month’s infographic in the usual rotation, or this month’s if it hasn’t gone out yet. For more informations read our delivery policy.
Payment link goes down here.
You can also browse our GUMROAD page.
Our added services-
Crafting premium, user‑focused websites that blend creativity with functionality. I design websites that not only look stunning but also deliver seamless user experiences. From clean layouts and intuitive navigation to responsive design and SEO‑ready structures, every project is built to empower businesses and creators online.
QnA
We sell and create digital product like infographics to help people of different creative background.
You can order custom template and more as per your requirement.
Yes, we do fill data and edit things around data to make it as relevant as possible.
Immediately, you will receive your pdf in the confirmation or thank you page after you make a payment, And that pdf contains a link to the template.
Depends on your order, number of templates or pages and more.
In “Contact us” page